Housing Market 2026: Key Metrics Every Buyer Should Watch
The numbers don't lie — and right now, they're telling a story of persistent unaffordability, constrained supply, and a market that still hasn't corrected.
· 6 min read · By AHI Research

If you're thinking about buying a home in 2026, gut feelings and headlines won't cut it. The housing market is driven by measurable, trackable data points — and understanding them is the difference between making a sound investment and overpaying by tens of thousands of dollars. This guide breaks down the key metrics that define the 2026 housing market and what they signal about where things are heading.
The State of the 2026 Housing Market
The 2026 housing market is best described as a stalemate. Sellers who locked in 3% mortgage rates during 2020-2021 refuse to list their homes and take on a new mortgage at double the rate. Buyers face elevated prices and borrowing costs that make monthly payments historically punishing. The result is a market frozen in place — low transaction volume, stubbornly high prices, and an affordability crisis that shows no signs of resolving itself through government intervention.
Understanding where the market stands — and where it's going — requires watching a specific set of indicators. Here are the ones that matter most.
Mortgage Rates: The Single Most Important Variable
No metric moves the housing market more than mortgage rates. As of early March 2026, the 30-year fixed mortgage rate sits at approximately 6.5%, down from the 7.8% peak in late 2023 but still dramatically above the 2.65% low reached in January 2021.
30-Year Fixed Rate (March 2026): ~6.5%
Federal Funds Rate: 4.25%-4.50%
2023 Peak: 7.8%
2021 Low: 2.65%
Monthly Payment on $415K at 6.5%: ~$2,625 (P&I)
The Federal Reserve's federal funds rate, currently in the 4.25%-4.50% range, sets the floor for borrowing costs across the economy. While the Fed doesn't directly set mortgage rates, the two are closely correlated. The Fed has signaled a cautious easing path through 2026, with markets pricing in one to two additional 25-basis-point cuts by year-end. If those materialize, 30-year rates could drift toward the low 6% range — meaningful for monthly payments, but nowhere near enough to restore the affordability of the sub-4% era.
For buyers, the key insight is this: don't wait for 4% rates. The conditions that produced those rates — near-zero Fed funds rate, trillions in quantitative easing, and a global pandemic — were historically anomalous. A rate in the 5.5%-6.5% range is much closer to the long-run norm.
Median Home Prices: Elevated and Sticky
The national median existing home price in early 2026 stands at approximately $415,000, according to data from the National Association of Realtors. That figure represents a roughly 3.5% year-over-year increase — a deceleration from the double-digit gains of 2021-2022, but still positive price growth in a market where many expected a correction.
March 2026: ~$415,000
March 2025: ~$401,000
March 2024: ~$393,000
March 2022: ~$375,000
March 2020: ~$280,000
Year-over-Year Change: +3.5%
Why haven't prices fallen despite high rates? The answer is supply. Existing homeowners have no incentive to sell, so inventory remains historically tight. And as long as there are more willing buyers than available homes, prices hold. This is Economics 101 — when supply is constrained, even reduced demand may not be enough to push prices down.
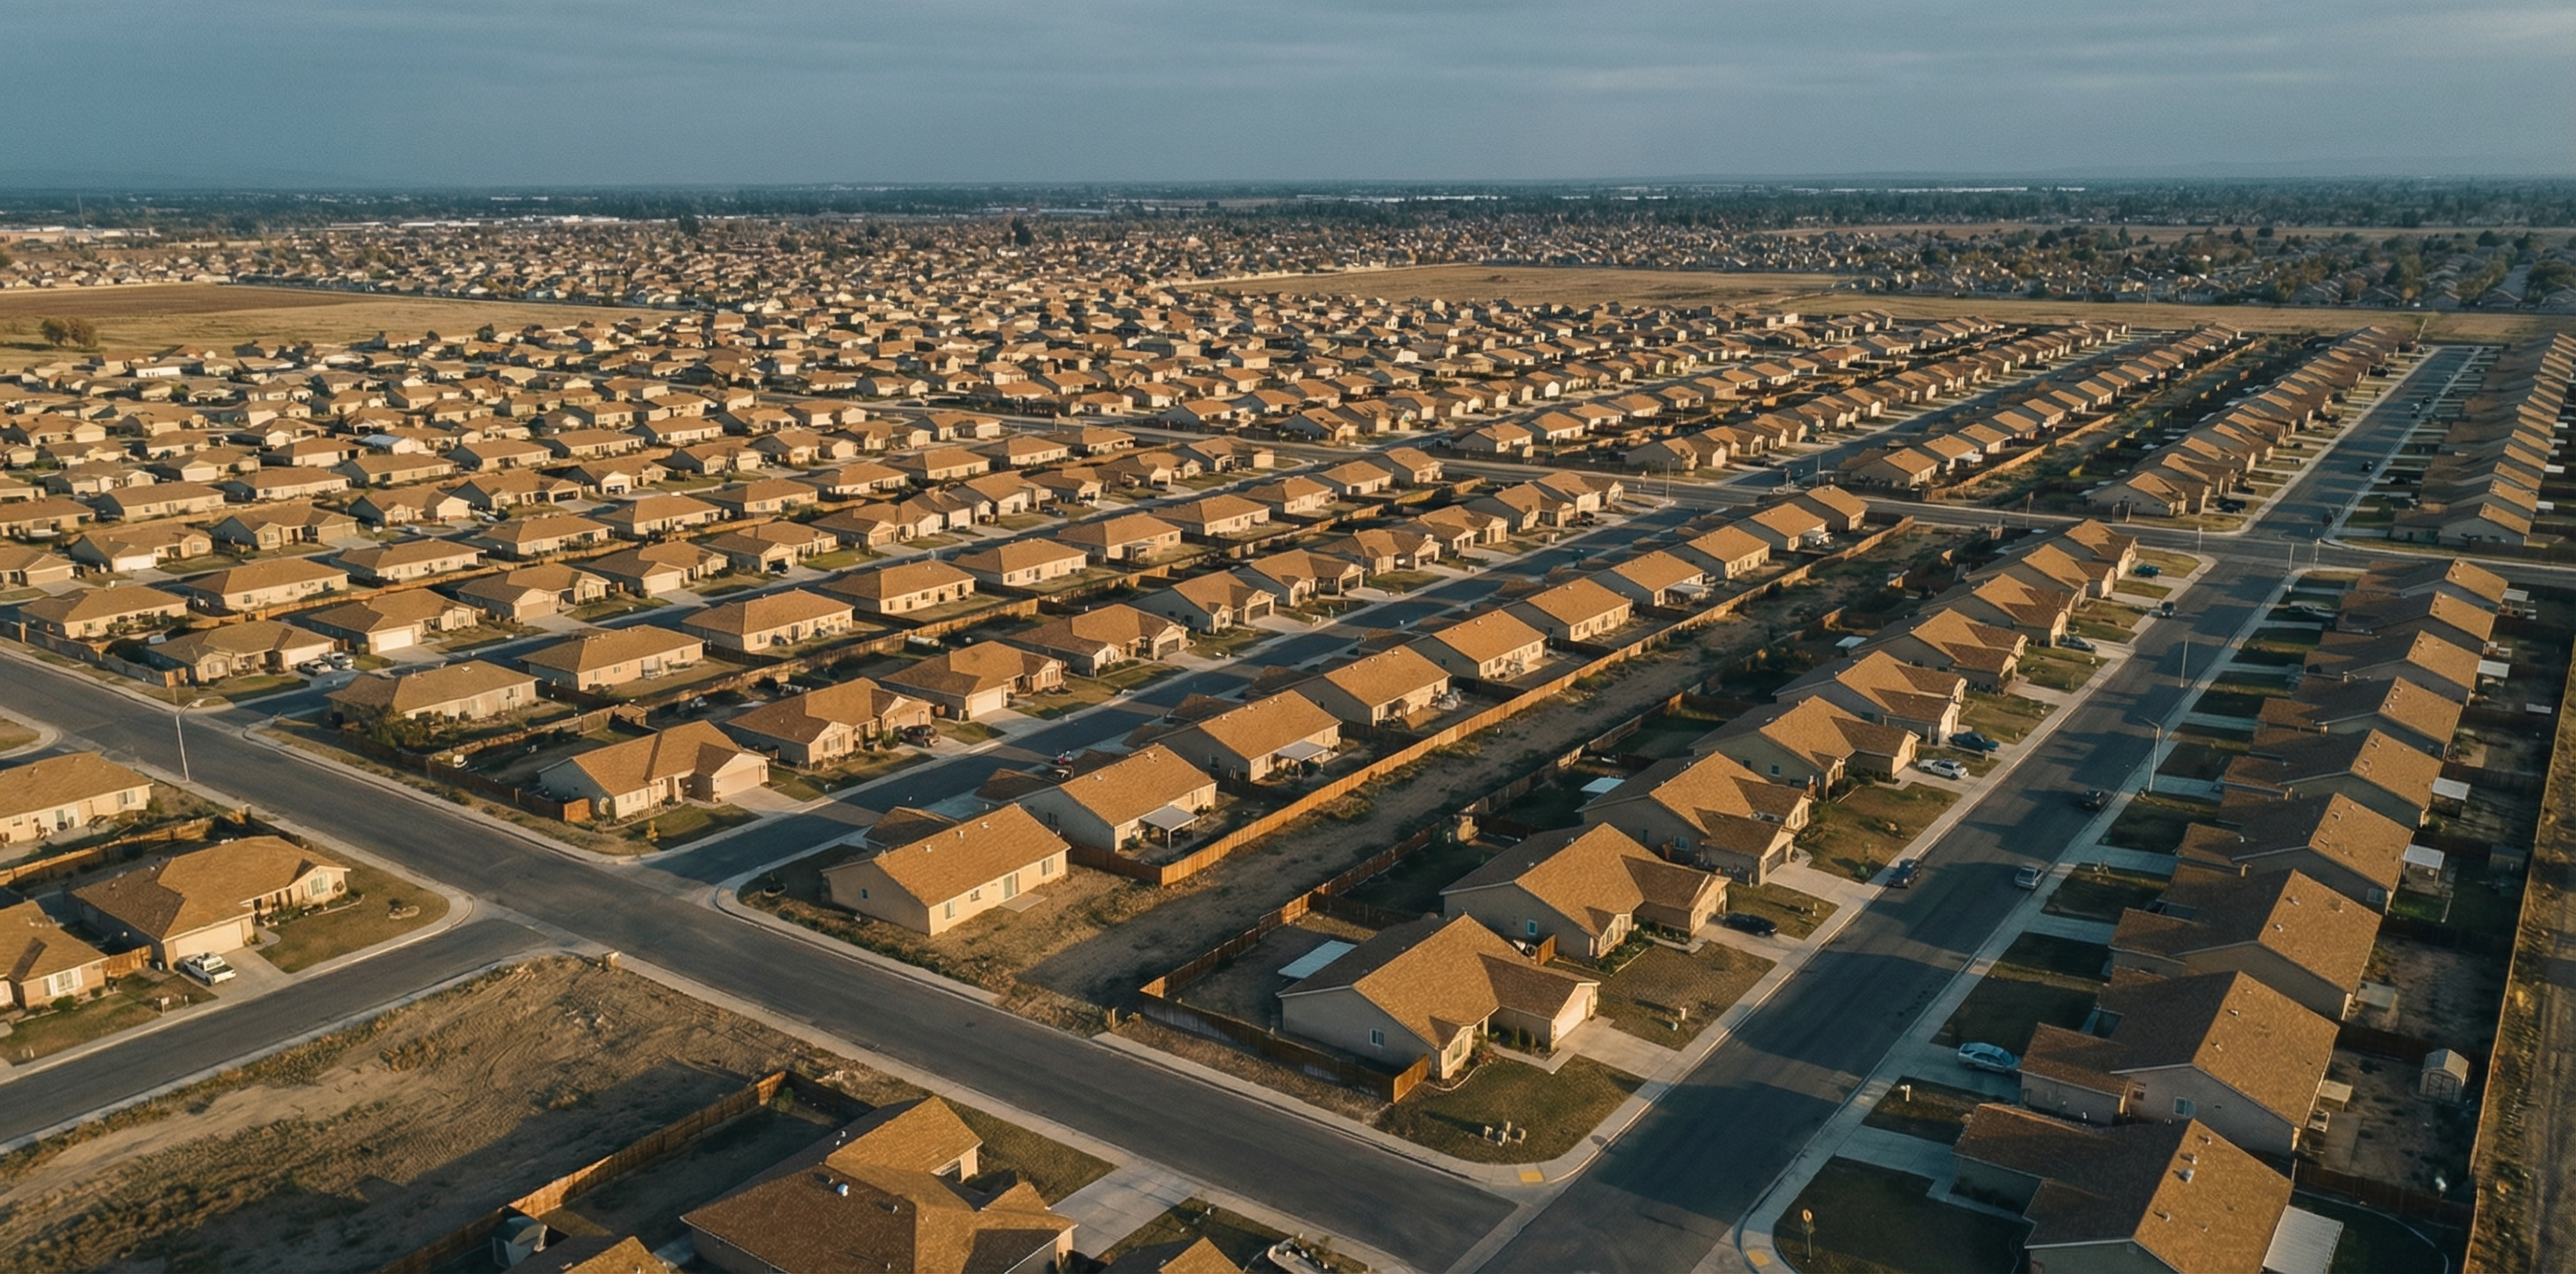
Housing Inventory: The Lock-In Effect
Inventory is the metric that explains almost everything wrong with the current market. As of early 2026, the United States has approximately 3.5 months of housing supply. A balanced market — one where neither buyers nor sellers have a dominant advantage — typically requires 5 to 6 months of supply.
Current Months of Supply: ~3.5 months
Balanced Market: 5-6 months
Active Listings (national): ~1.05 million
Pre-Pandemic Norm (2019): ~1.5 million
Housing Deficit (estimated): 3-5 million units
The so-called "lock-in effect" is the primary culprit. Roughly 60% of outstanding mortgages carry rates below 4%, and over 80% are below 5%. These homeowners are financially trapped in their current homes — selling would mean taking on a new mortgage at 6.5%, adding hundreds or even thousands of dollars to their monthly payment for the same quality of housing. So they stay put, and inventory stays low.
This is the direct consequence of the Federal Reserve's monetary interventions. Years of artificially suppressed rates created a market distortion that didn't end when rates rose — it simply transformed into a different kind of crisis.
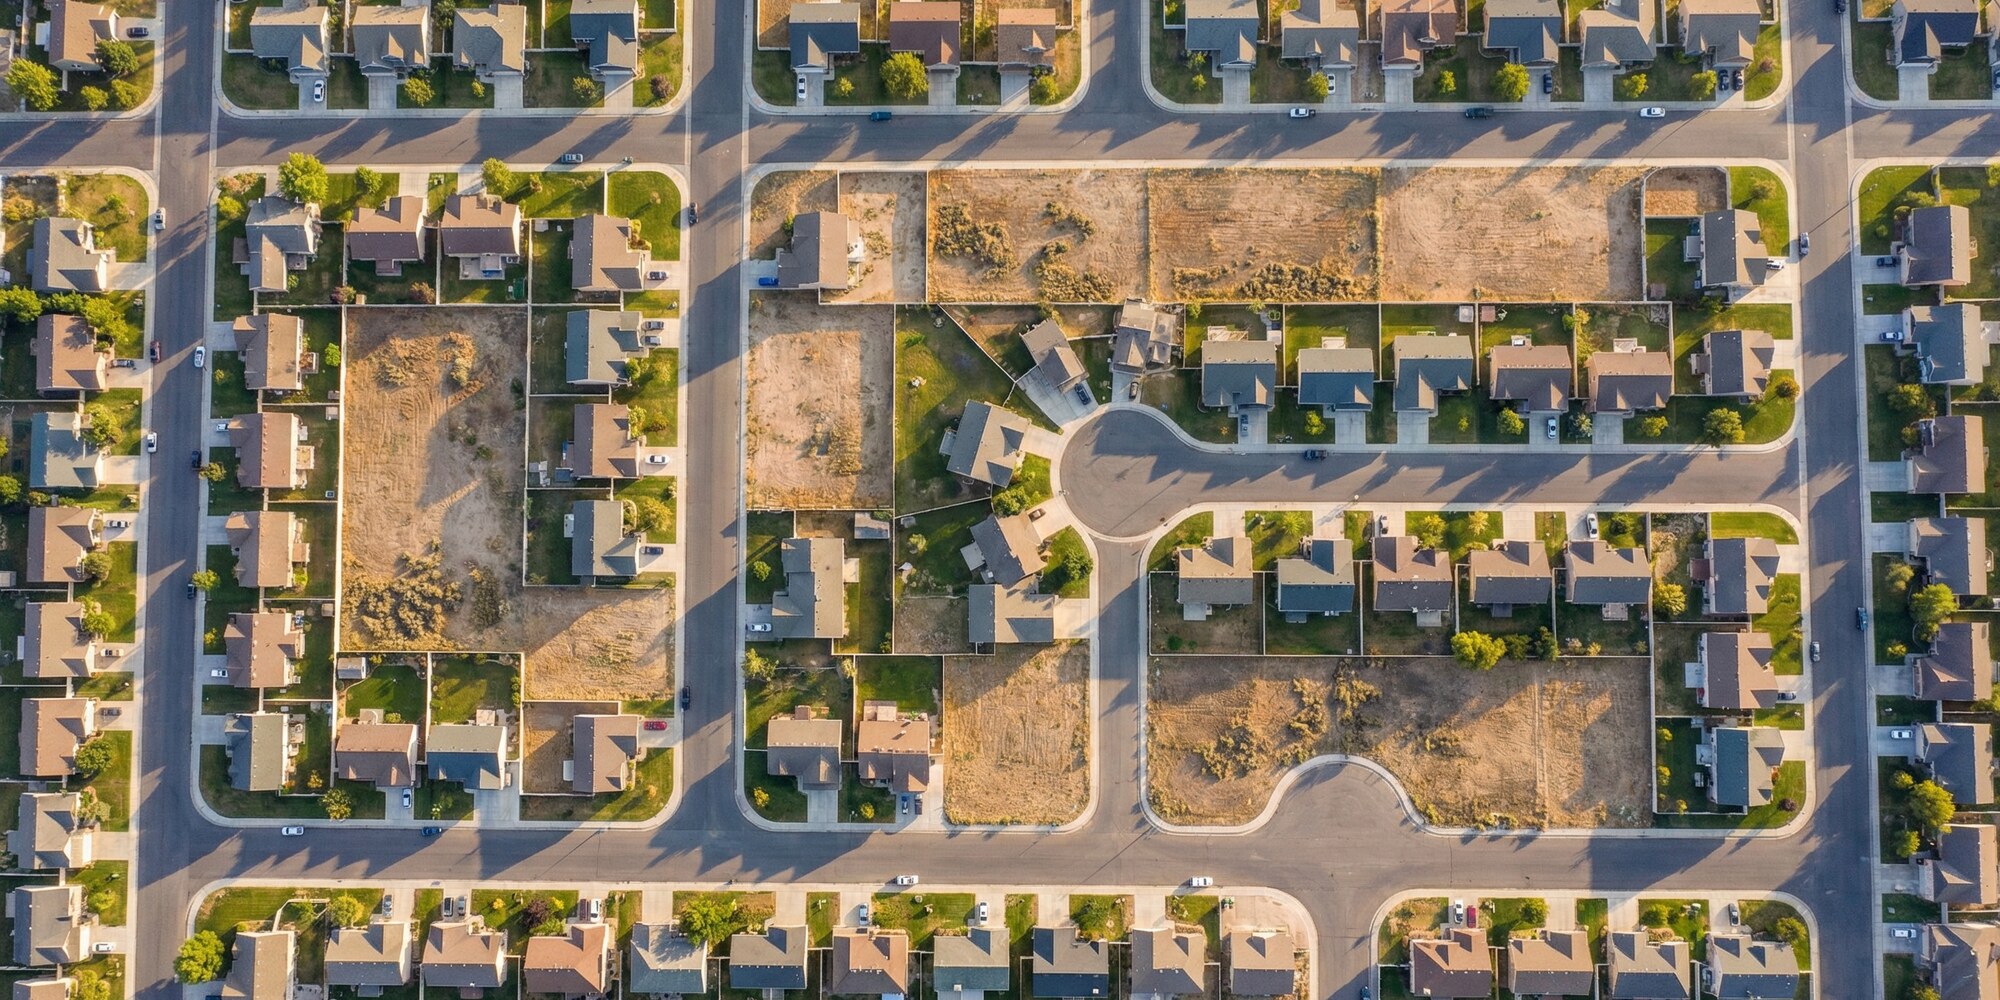
Housing Starts and Building Permits
New construction is the only long-term path to solving the housing shortage. The data here is mixed. Housing starts in early 2026 are running at an annualized pace of roughly 1.4 million units, with single-family starts around 1.0 million. Building permits — a leading indicator of future construction — are tracking at approximately 1.45 million annualized.
Housing Starts (annualized): ~1.4 million
Single-Family Starts: ~1.0 million
Building Permits (annualized): ~1.45 million
Estimated Annual Demand: 1.5-1.7 million
Cumulative Housing Deficit: 3-5 million units
These numbers represent a recovery from the 2022-2023 construction slowdown, when high rates and rising material costs froze many projects. But they remain well below the estimated 1.5 to 1.7 million units per year needed to keep pace with household formation and begin addressing the accumulated deficit of 3 to 5 million homes.
The bottleneck isn't demand for new homes — it's the regulatory environment that makes building slow, expensive, and unpredictable. Permitting timelines, zoning restrictions, environmental review requirements, and labor shortages all throttle the supply response that the market desperately needs.
The Housing Affordability Index
The Housing Affordability Index (HAI), published monthly by the National Association of Realtors, measures whether a typical family earns enough to qualify for a mortgage on a median-priced home. An index value of 100 means the median family has exactly enough income to qualify. Above 100 means housing is affordable; below 100 means it isn't.
Current HAI Reading: ~93
What 100 Means: Median family can just barely qualify
Historical Average (1990-2019): ~140
2021 Peak: ~170
Current Status: Worst affordability in 40+ years
The current reading of approximately 93 means the median American family does not earn enough to qualify for a mortgage on the median-priced home. This is the worst affordability reading in over 40 years, surpassing even the pre-crisis levels of 2006. The combination of $415,000 home prices and 6.5% mortgage rates has pushed monthly payments to levels that are simply incompatible with median incomes.
During the low-rate era of 2020-2021, the HAI surged to 170, masking the underlying price inflation. Now that rates have normalized, the true cost of those inflated prices is fully visible — and it's devastating for first-time buyers.
Days on Market and List-to-Sale Price Ratio
Two additional metrics provide insight into buyer-seller dynamics on the ground:
Median Days on Market (DOM) currently sits at approximately 42 days nationally, up from the frenzied 18-day median of early 2022 but still below the pre-pandemic norm of 55-65 days. The market has cooled from its most overheated levels, but homes are still selling relatively quickly in most metro areas.
The list-to-sale price ratio — the final sale price as a percentage of the original asking price — is running at about 98.5% nationally. In 2022, this figure exceeded 102% in many markets as buyers routinely bid above asking. Today's figure suggests that sellers are getting close to asking price but no longer commanding bidding wars in most markets.
Median Days on Market: ~42 days
Pre-Pandemic Norm: 55-65 days
2022 Frenzy Low: ~18 days
List-to-Sale Price Ratio: ~98.5%
2022 Peak: 102%+
These numbers tell a consistent story: the market has normalized from the pandemic mania, but it hasn't tipped in buyers' favor. There is no broad-based price correction underway — just a slower, more orderly version of the same seller-advantaged market.
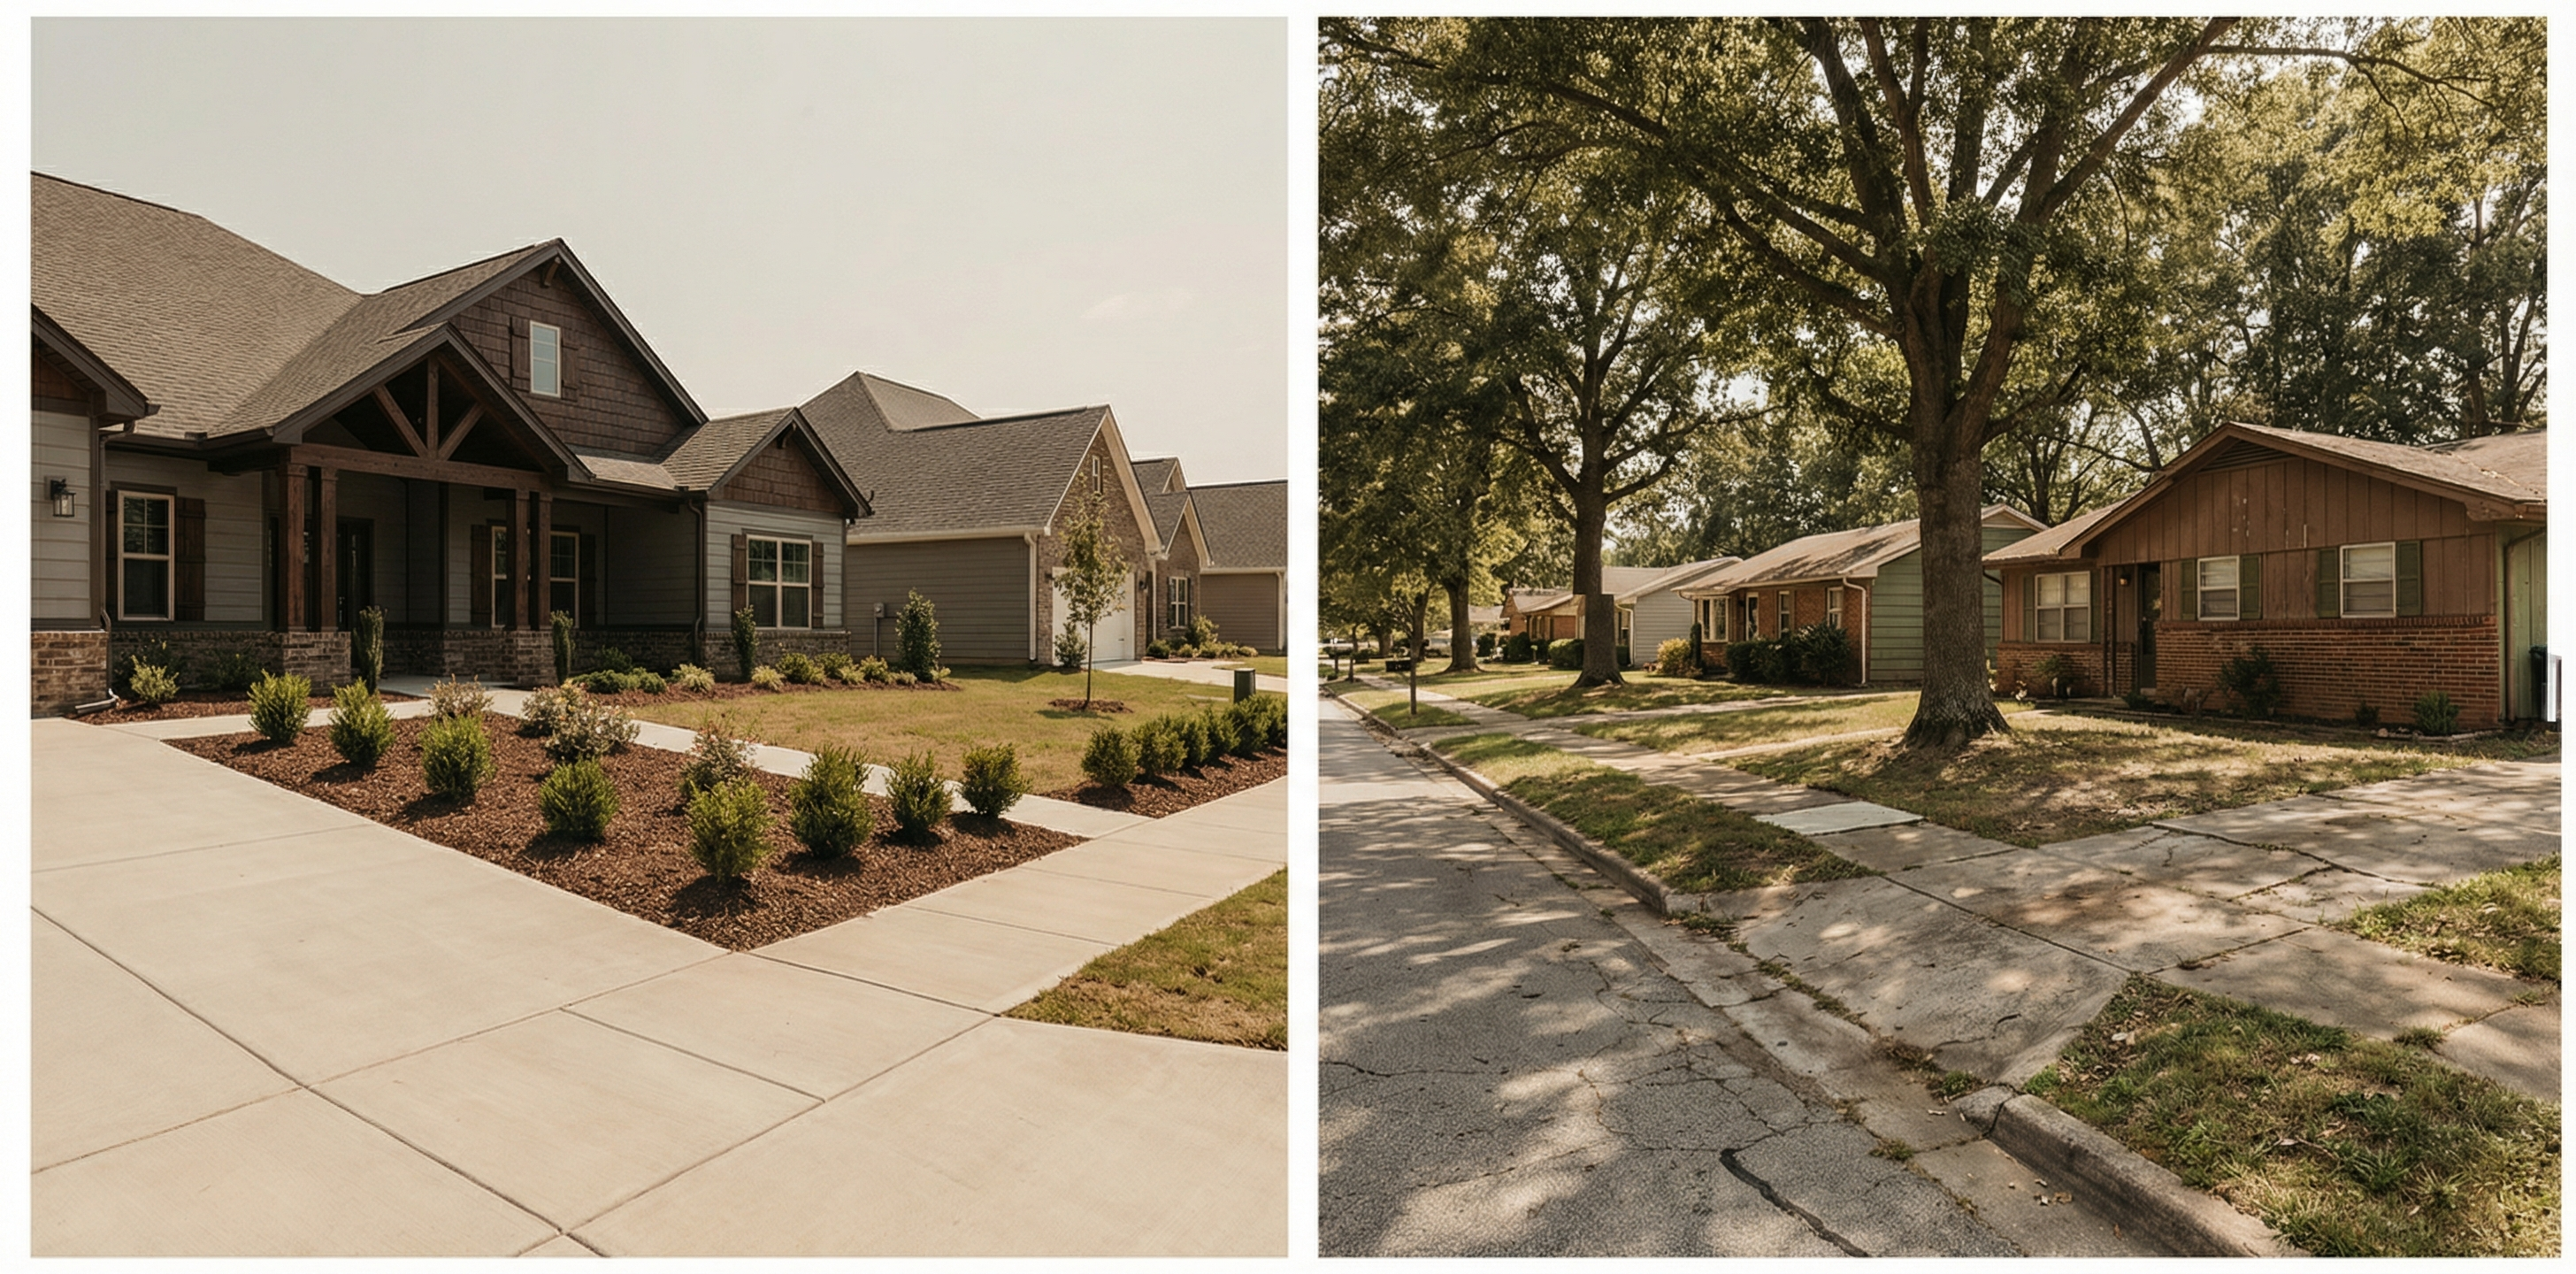
Regional Variations: Not All Markets Are Equal
National metrics are useful, but real estate is fundamentally local. The 2026 market shows stark regional divergence:
- Sun Belt markets (Phoenix, Austin, Dallas, Tampa) are experiencing the most noticeable cooling. Years of rapid in-migration drove aggressive construction, and some of these markets now have inventory levels approaching 5 months — close to balanced territory. Price growth has stalled or turned slightly negative in select submarkets, particularly in Austin and San Antonio.
- Coastal metros (New York, Boston, San Francisco, Los Angeles, Seattle) remain deeply supply-constrained due to restrictive zoning and land-use regulations. Inventory in these markets sits at 2 to 3 months, and prices continue to climb. Median prices in San Francisco and New York exceed $1 million, placing homeownership out of reach for all but the highest earners.
- Midwest and heartland markets (Indianapolis, Columbus, Kansas City, Omaha) offer the strongest affordability metrics in the country. Median prices in the $250,000-$325,000 range, combined with fewer regulatory barriers to construction, keep these markets more accessible — though even here, affordability has deteriorated significantly from 2019 levels.
The lesson is clear: geography matters enormously. A buyer in Indianapolis faces a fundamentally different market than a buyer in San Francisco, and national metrics can obscure these critical differences.
What These Metrics Mean Through a Free-Market Lens
When you step back and view these numbers as a whole, a consistent pattern emerges. Every metric that signals dysfunction — low inventory, record unaffordability, insufficient construction, sticky high prices — traces back to government intervention distorting market signals.
The Federal Reserve's rate manipulation inflated prices and created the lock-in effect that now starves the market of inventory. Local zoning laws and regulatory burdens prevent the supply response that would naturally bring prices down. Federal mortgage guarantees and tax subsidies inflate demand beyond what a free market would produce. And rent control policies in major cities further discourage new housing investment.
A genuinely free housing market would look dramatically different from what we see today. Interest rates would reflect actual savings rates rather than central bank targets. Builders would respond to price signals by constructing more homes, not waiting years for permits. And prices would adjust — in both directions — based on the real forces of supply and demand.
"The curious task of economics is to demonstrate to men how little they really know about what they imagine they can design." — Friedrich Hayek
The housing market's current distress is not evidence of market failure. It's evidence of what happens when policymakers believe they can manage one of the most complex markets in the economy better than the price system itself.
The Bottom Line for 2026 Buyers
Here's what the data tells us. Mortgage rates will likely remain in the 6%-7% range through 2026, with modest declines possible. Home prices are not going to crash — inventory is too low and demand too persistent. Affordability will remain at or near its worst levels in four decades. And new construction, while recovering, won't close the supply gap for years.
For prospective buyers, the actionable takeaway is this: watch the data, not the headlines. Track your local inventory levels. Monitor the spread between the 10-year Treasury yield and mortgage rates. Pay attention to building permit trends in your target market. And above all, run the numbers on what you can actually afford at today's rates — not what you hope rates might be in six months.
The market won't be rescued by government programs or central bank rate cuts. The path to genuine housing affordability runs through deregulation, increased construction, and the restoration of honest price signals. Until then, informed buyers who understand the metrics will make better decisions than those waiting for a bailout that isn't coming.