
Free-Market Housing Policy Research
Why housing got unaffordable — and what actually fixes it.
Rigorous, data-driven analysis of monetary policy, zoning, rent control, and housing supply — grounded in the economics of Friedman, Sowell, and Hayek.
- 6.49% 30-yr fixed mortgage
- 332.7 Case-Shiller home-price index
- 1,177 Housing starts (000s, SAAR)
"Underlying most arguments against the free market is a lack of belief in freedom itself." — Milton Friedman
Featured
The analysis readers start with
-

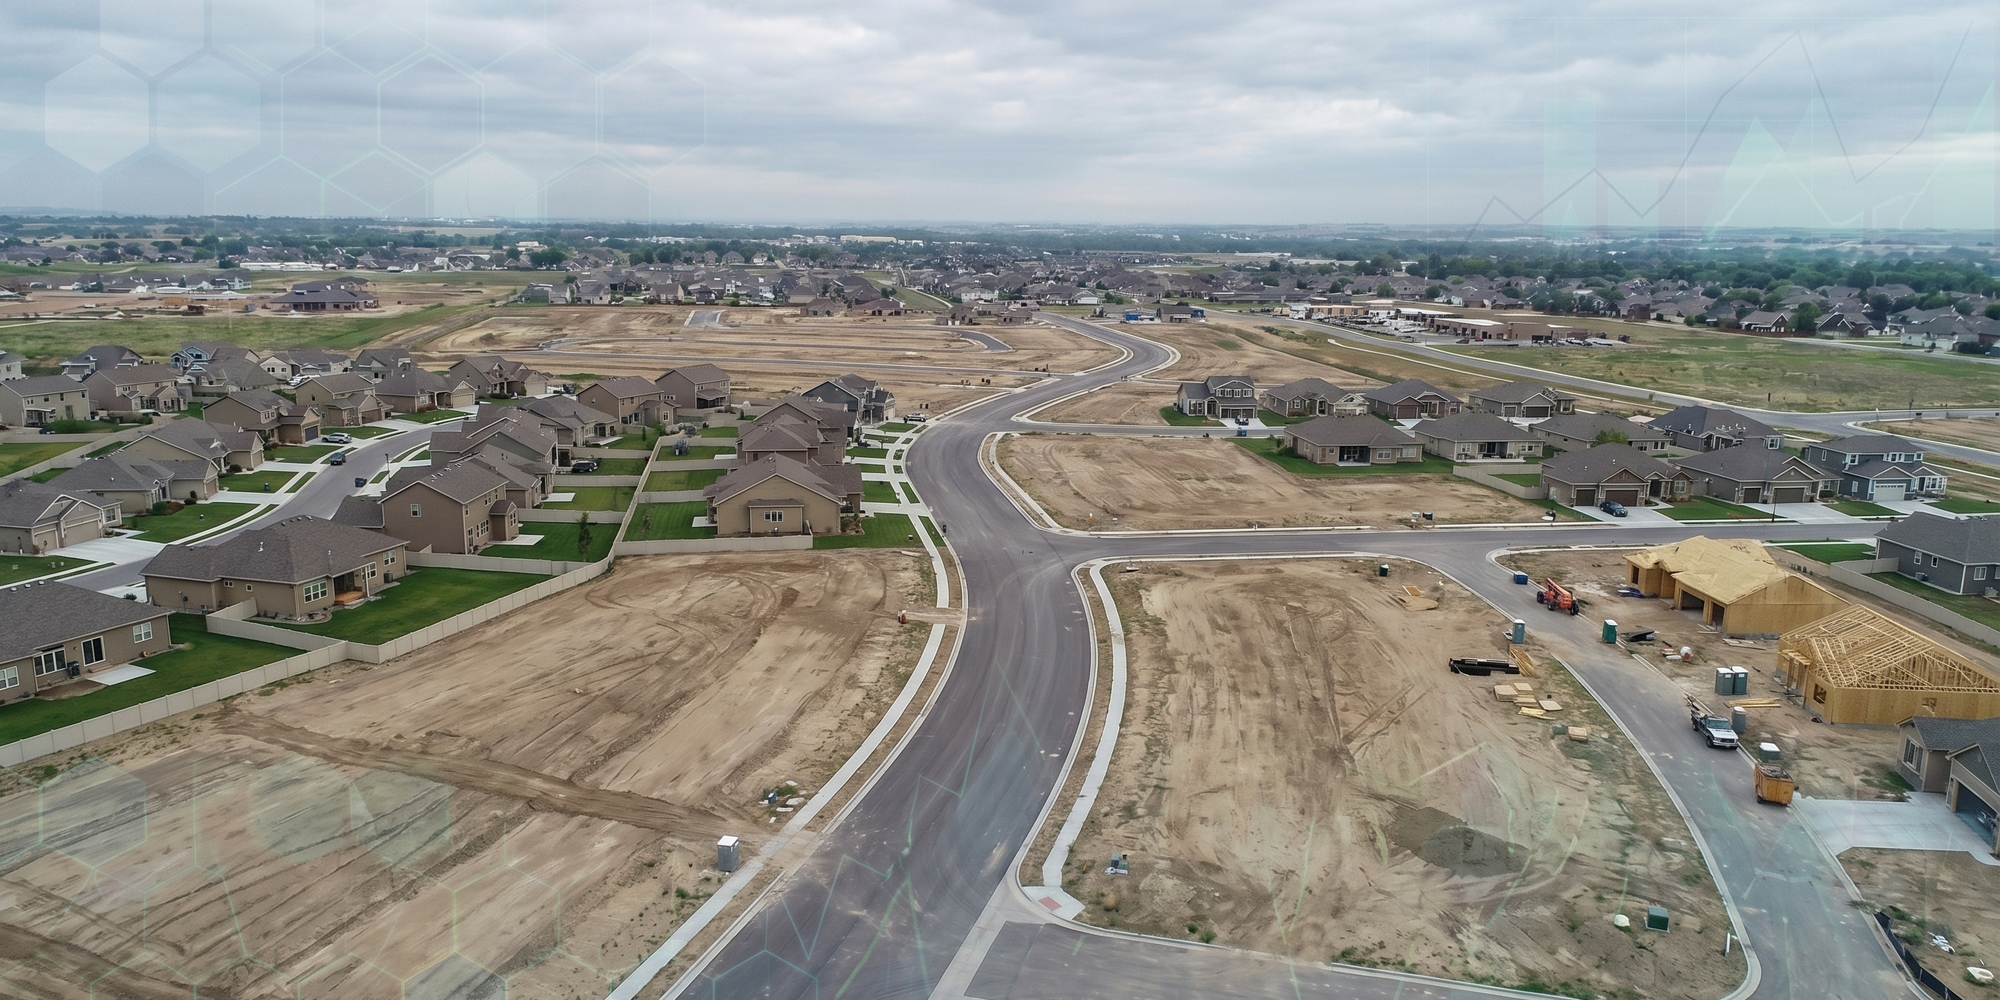
Mortgage rates near 6.3% and local supply barriers are jointly squeezing affordability in 2026. Why free-market reform must target both financing burden and build constraints.
-
 Policy Analysis
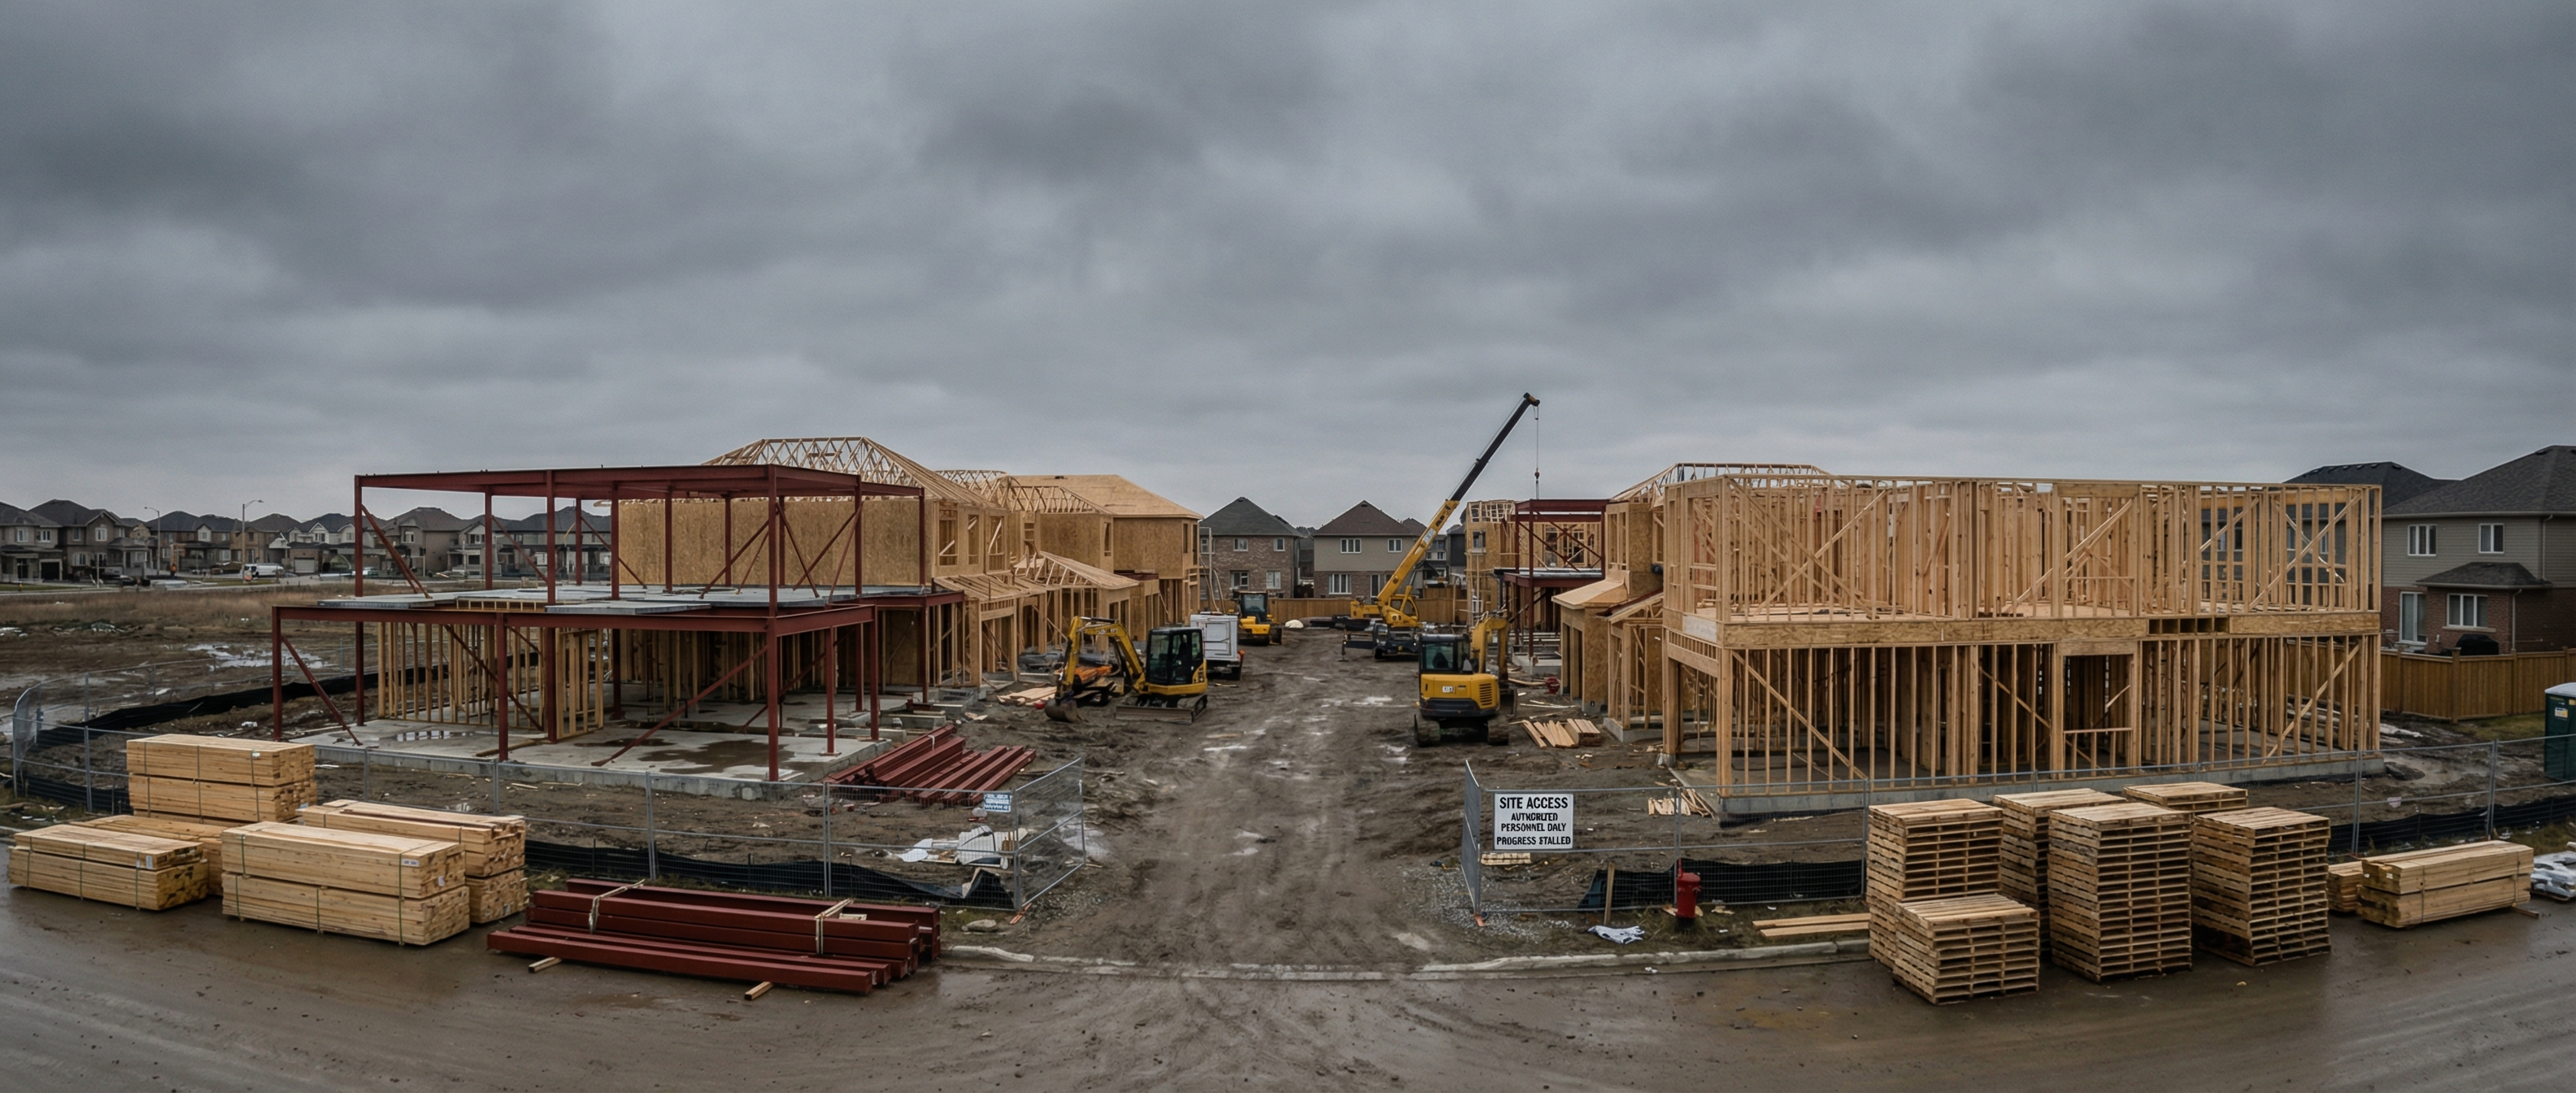
The Conforming-Loan Ratchet: Why Higher Federal Loan Limits Cannot Fix Housing Affordability on Their Own
FHFA raised 2026 conforming loan limits to $832,750, but supply data and mortgage-rate evidence show why bigger loan ceilings cannot solve affordability alone.
-
 Monetary Policy
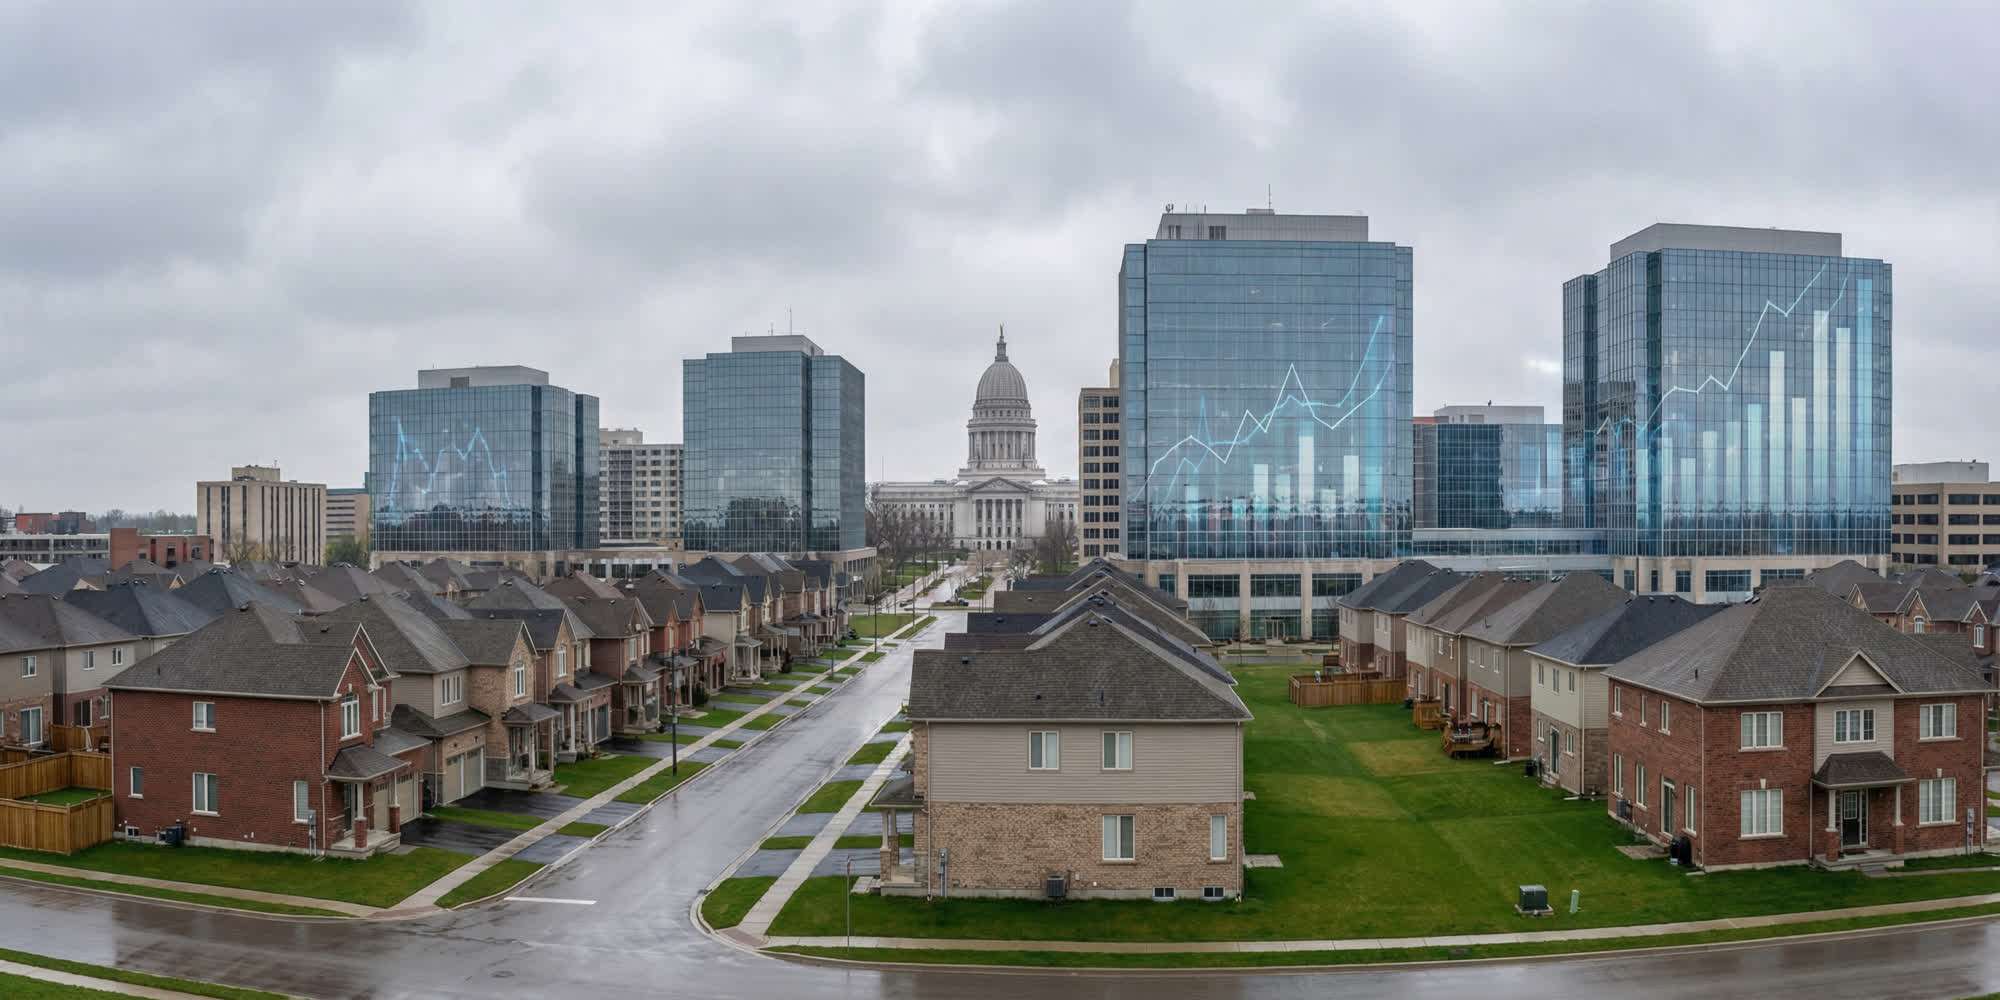
The Payment Shock Pipeline: How Zero-Rate Policy Pulled Housing Demand Forward and Locked Out Today’s Buyers
Fed-era ultra-low rates pulled housing demand forward, lifted home prices 53.8% since 2020, and left today’s buyers facing far higher monthly payments at 6%+ mortgage rates.
Live feed
Latest housing & economy news
Headlines aggregated daily from public news feeds and linked to their original publishers. Displayed for commentary; not endorsements.
Last updated July 16, 2026.
-
In first Congressional testimony, new Fed Chief Warsh vows to fight inflation
Kevin Warsh testified before the Senate Banking Committee for the first time Wednesday since taking over as chairman of the Federal Reserve. Warsh pledged to bring inflation under control.
-
Inflation cools more than expected in June as gas costs fall and underlying prices ease
Tuesday's report likely reduces pressure on the Fed to boost its short-term interest rate to combat inflation.
-
WATCH: Fed chair Kevin Warsh testifies on inflation and monetary policy in House hearing
Federal Reserve Chair Kevin Warsh said Tuesday that the Fed will make high inflation "a thing of the past," yet he provided no signal about the central bank's next steps.
-
New Fed Chair Kevin Warsh isn't as focused on employment, part of the dual mandate
The Federal Reserve has two main goals: price stability and maximum employment. But new Fed Chair Kevin Warsh seems to be leaning into price stability and away from full employment as equal goals.
-
Inflation eased in June, but Americans still feel pressure from high prices
A report shows inflation eased more than expected in June. It's welcome news for President Trump, who has made lowering prices a focus of his economic agenda. But months of higher-than-expected inflation have continued to squeeze many households and raised questions about when consumers will feel relief. Liz Landers re
-
U.S. home prices hit an all-time high as sales slow and mortgage rates rise
Sales of previously occupied U.S. homes slowed in June, but a key measure of home prices climbed to an all-time high, adding to prospective homebuyers' affordability challenges.
-
Trump administration imposing 25 percent tariff on some imports from Brazil
The Trump administration is imposing 25 percent tariffs on certain goods imported from Brazil, after an investigation concluded the South American country employed unfair trade practices. The office of U.S. Trade Representative Jamieson Greer said Wednesday that the yearlong probe into Brazilian practices determined th
-
DHS pledged body cams for all immigration agents. Months later, that hasn't happened
In recent days, federal immigration agents fatally shot two immigrant fathers. None of the federal officers involved were wearing body cameras, the agency said.
The numbers
Key economic indicators
Federal Reserve data most relevant to housing affordability, refreshed daily.
Last updated July 16, 2026.
-
30-Year Fixed Rate Mortgage Average in the United States
6.49
▲ +0.06 (up)
Percent · as of July 9, 2026
-
S&P Cotality Case-Shiller U.S. National Home Price Index
332.678
▲ +2.55 (up)
Index Jan 2000=100 · as of April 1, 2026
-
New Privately-Owned Housing Units Started: Total Units
1177
▼ -215.00 (down)
Thousands of Units · as of May 1, 2026
-
Median Sales Price of Houses Sold for the United States
403200
▼ -9100.00 (down)
Dollars · as of January 1, 2026
Source: FRED, Federal Reserve Bank of St. Louis. See the full housing-data dashboard →
Fresh off the desk
Recent analysis
-
Mortgage rates near 6.3% and local supply barriers are jointly squeezing affordability in 2026. Why free-market reform must target both financing burden and build constraints.
-
Policy Analysis
The Conforming-Loan Ratchet: Why Higher Federal Loan Limits Cannot Fix Housing Affordability on Their Own
FHFA raised 2026 conforming loan limits to $832,750, but supply data and mortgage-rate evidence show why bigger loan ceilings cannot solve affordability alone.
-
Monetary Policy
The Payment Shock Pipeline: How Zero-Rate Policy Pulled Housing Demand Forward and Locked Out Today’s Buyers
Fed-era ultra-low rates pulled housing demand forward, lifted home prices 53.8% since 2020, and left today’s buyers facing far higher monthly payments at 6%+ mortgage rates.
-
Policy Analysis
The Mortgage Ladder Keeps Rising: How FHA and Conforming-Loan Expansion Inflate Demand Faster Than Supply
FHA and conforming-loan expansion widened mortgage credit while supply stayed constrained. Data shows rising debt, elevated prices, and affordability that still excludes new buyers.
-
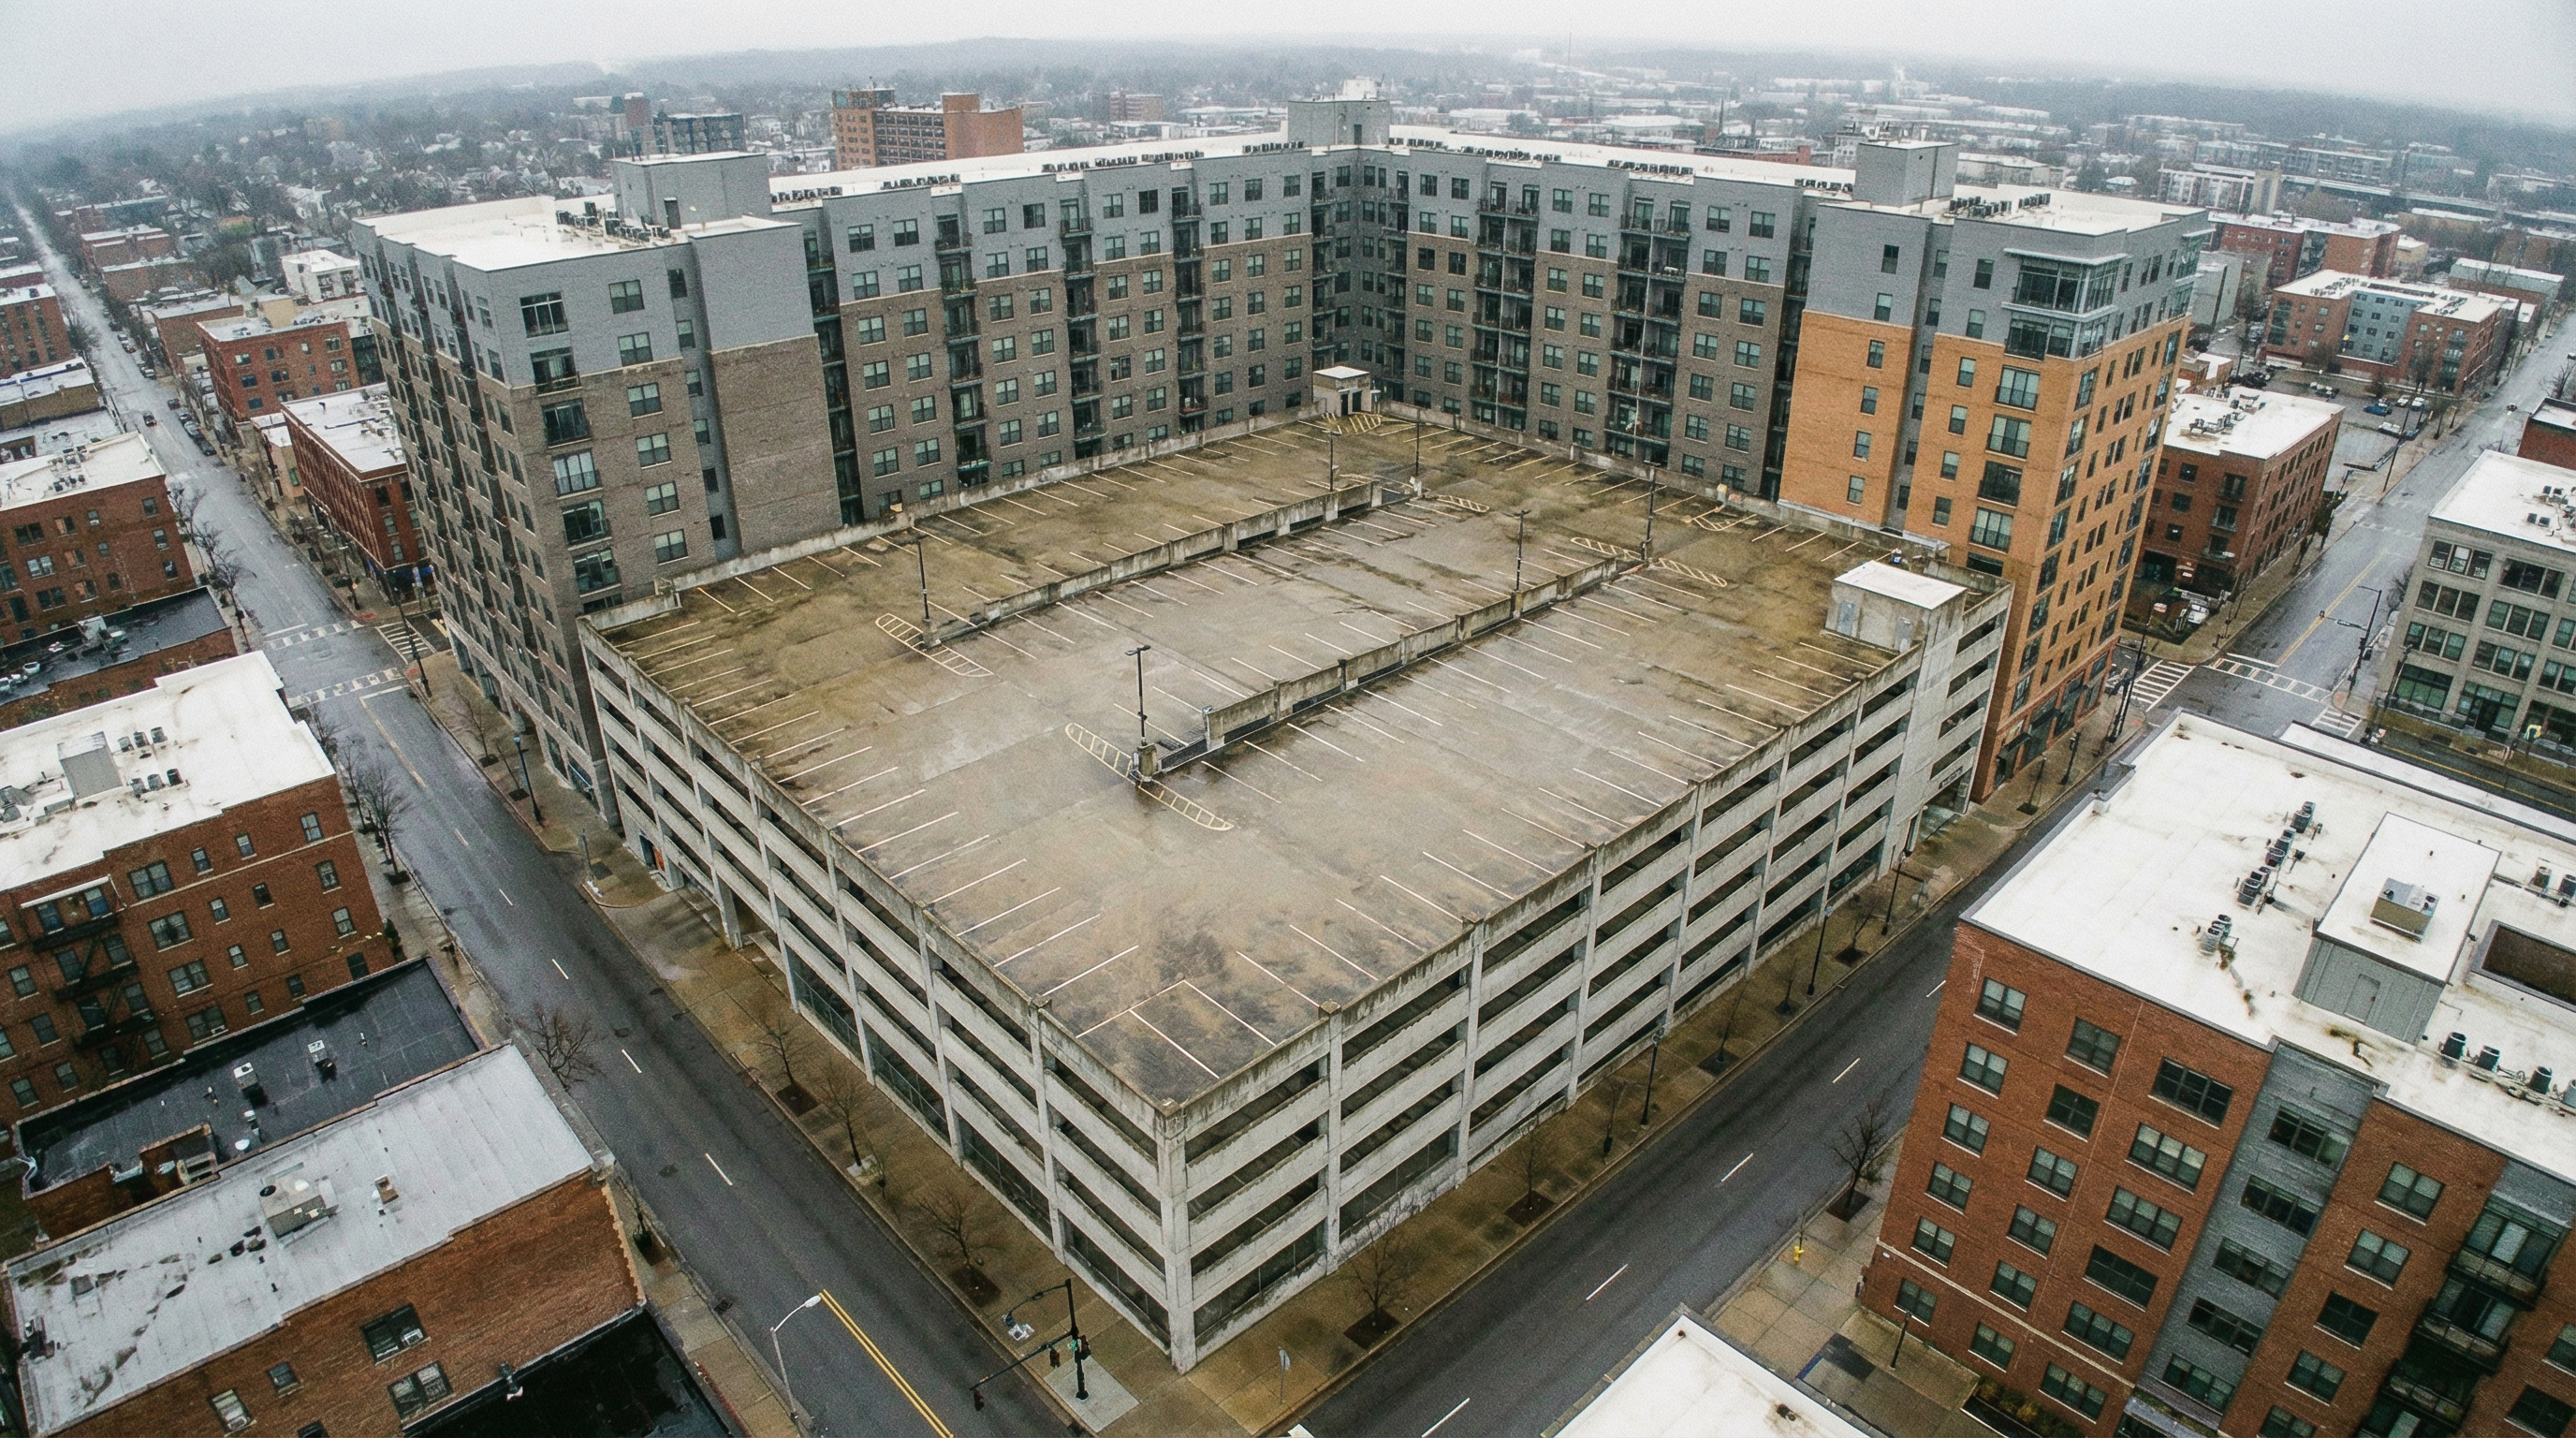
Zoning & Supply
Houston's Housing Lesson: What America's Largest Unzoned City Reveals About Supply, Prices, and Central Planning

Houston is America's largest city without traditional zoning — and its housing costs 20% below the national average. The data on markets vs. mandates.
-
One year after Liberation Day, the data is in: tariffs on construction materials function as a government-imposed excise tax on housing supply, raising the cost floor by $7,000–$13,000 per home.
-
Zoning & Supply
Frozen in Place: How Historic Preservation Zoning Locks America's Priciest Neighborhoods in Permanent Housing Scarcity

Historic preservation laws function as permanent supply restrictions. With 38,000+ landmark properties in NYC alone and 20% of Manhattan locked under LPC review, the costs fall on everyone who needs housing.
-
Policy Analysis
The Moving Tax: How Real Estate Transfer Levies Freeze Housing Supply and Hit Working Families Hardest

Real estate transfer taxes promise easy revenue for affordable housing — but the data show they suppress supply, trap families in place, and devastate the very budgets they claim to fix.
-
Zoning & Supply
The States That Said No to Local Veto Power: How Zoning Preemption Is Unlocking America's Missing Housing Supply

From Oregon's 2019 reform to Montana's bipartisan duplex law, states are discovering the most powerful affordable housing tool costs nothing: removing the prohibition on building.
-
Zoning & Supply
The Parking Tax: How Mandatory Minimum Parking Requirements Drive Up the Cost of Every New Home
Minimum parking requirements embedded in local zoning codes add tens of thousands of dollars to every new home and apartment — a government-mandated tax on housing that no market would have imposed.
-
Policy Analysis
The Tariff Surcharge Nobody Talks About: How Metal Price Inflation Is Adding Thousands to Every New Home
BLS data shows metal molding and trim up 61.7% year-over-year, metal windows up 20.2%. In the post-SCOTUS tariff era, these costs are embedded in every new home.
-
Policy Analysis
The Federal Home Loan Bank System: America's Hidden $1 Trillion Housing Finance Subsidy

The Federal Home Loan Bank System provides over $1 trillion in government-backed advances to member banks, inflating mortgage demand and housing prices for 90 years. A free-market analysis.
Explore
Topics we cover
- Monetary Policy Federal Reserve rates, inflation, quantitative easing & asset price distortion
- Zoning & Supply Land use restrictions, NIMBYism, density reform & housing supply constraints
- Rent Control Price ceilings, shortage effects, empirical data & tenant impact studies
- Market Data Housing prices, mortgage rates, inventory levels & economic indicators
- Policy Analysis Government programs, subsidy distortions, FHA, GSE reform & housing regulation
- Friday Recap Weekly housing market data, mortgage rates & policy roundup
FAQ
Frequently asked questions
The affordable housing crisis is primarily driven by restrictive zoning laws that limit housing supply, Federal Reserve monetary policy that inflates asset prices, government-imposed regulatory compliance costs that increase construction expenses, and rent control policies that discourage new development and reduce available rental inventory.
The Federal Reserve's low interest rate policies and quantitative easing programs increase the money supply, driving capital into real estate assets. This inflates home prices beyond what wage growth supports, making housing unaffordable for middle and lower-income families. When rates rise rapidly, affordability worsens further as mortgage payments spike while elevated prices persist.
Economic research consistently shows that rent control reduces the overall supply of rental housing, leads to deterioration of housing quality, creates black markets, and benefits incumbent tenants at the expense of newcomers. Studies from Stanford, MIT, and other institutions demonstrate that rent control ultimately makes housing less affordable and less available in the long run.
Restrictive zoning regulations — including single-family zoning, minimum lot sizes, height restrictions, and parking requirements — artificially constrain housing supply in high-demand areas. Research shows that these regulations can increase home prices by 20-50% in heavily regulated markets. Zoning reform that allows greater density and mixed-use development is one of the most effective ways to increase housing supply and reduce costs.
The free-market approach focuses on removing government barriers to housing supply: eliminating restrictive zoning, reducing regulatory compliance costs, ending government-backed mortgage subsidies that inflate prices, pursuing sound monetary policy, and allowing the market to naturally respond to demand. This approach draws from economists like Milton Friedman, Thomas Sowell, and Friedrich Hayek.
Government housing subsidies — including FHA loans, GSE guarantees through Fannie Mae and Freddie Mac, and the mortgage interest deduction — increase demand without addressing supply constraints. This drives up housing prices, disproportionately benefits higher-income homeowners, and shifts risk to taxpayers. Research suggests these programs contribute to housing price inflation rather than genuine affordability.
About
About this publication
The Affordable Housing Initiative publishes rigorous economic analysis grounded in Austrian and Chicago school thought — Milton Friedman, Thomas Sowell, Friedrich Hayek. We examine how monetary policy, zoning restrictions, rent control, government-backed mortgages, and regulatory compliance costs drive housing unaffordability. Every claim is backed by data or sourced economic research.