The Price Inversion: Why New Homes Are Now Cheaper Than Used Ones — and What It Reveals About the Housing Market
For most of American housing history, new construction commanded a premium over existing homes. That relationship has reversed — and the data tell a story that goes well beyond builder discounts.
· 8 min read · By Affordable Housing Initiative
From 2010 to 2019, a new single-family home cost an average of $66,000 more than an existing one. The premium was intuitive: new construction reflects current labor rates, current materials costs, current energy codes, and delivers a product that hasn't been lived in. Buyers have historically paid for that freshness. In Q4 2025, the median price of a new single-family home was $405,300 — $9,600 less than the median existing home at $414,900. This was the third consecutive quarter in which existing homes outsold new ones at a premium, part of a five-of-seven-quarter pattern of price inversion that began in Q2 2024.
The inversion is not a data anomaly. It is a structural signal about what government monetary policy has done to the housing market — and reading it clearly requires separating the two very different markets that now compose American housing: one where prices are held artificially above equilibrium by a policy-created freeze, and another where market forces are operating, imperfectly, under their own constraints.
The Historical Premium and Its Collapse
The $66,000 new-home premium of the 2010s reflected normal market dynamics. New construction carries higher production costs than existing homes, and buyers pay a premium for a new product. That premium narrowed during the post-pandemic period to an average of just $23,300 between 2020 and 2025 — and then turned negative. By Q2 2024, existing homes had crossed above new homes in median price. They have stayed there.
The direction of the two price series tells the story. New home prices fell 3.34% year-over-year in Q4 2025 — the second consecutive annual decline. Existing home prices rose 1.25% over the same period, the tenth consecutive quarter of year-over-year gains. One market is compressing. The other is rising. They are moving in opposite directions because they are subject to fundamentally different forces.
The regional picture complicates the simple national narrative. In the West, existing homes ($623,800) cost $66,700 more than new construction ($557,100) — a dramatic premium driven by California's severe supply restrictions on new building and the scarcity of existing inventory. In the South, the gap is nearly closed: existing homes ($367,200) exceed new homes ($366,100) by just $1,100. The South's comparatively lighter land-use regulation has allowed builders to compete more effectively on price. In the Northeast, new construction ($799,000) still carries a large premium over existing homes ($515,900) — reflecting the extraordinary cost of building in high-density, heavily regulated markets. The Midwest remains the outlier: new homes cost $60,700 more than existing ones, consistent with a market where supply constraints on existing inventory are less severe and land costs for new construction remain elevated relative to median prices.
What Froze the Existing Market
The existing home market's price resilience is not organic demand. It is supply suppression manufactured by monetary policy history.
During 2020 and 2021, the Federal Reserve held the federal funds rate at effectively zero and purchased mortgage-backed securities at a pace that drove 30-year fixed mortgage rates to historic lows — below 3% for much of that period. The consequence was a generation of locked-in homeowners. Approximately 60% of outstanding mortgages carry interest rates below 4%, according to the Consumer Financial Protection Bureau. With prevailing 30-year rates at 6.05% as of February 2026 (the lowest since August 2022, but still double the pandemic era floor), the economic calculation facing a homeowner who wants to sell is stark: list the house, buy another at twice the monthly payment on the same loan size, and absorb the cost. Millions of homeowners are choosing not to sell. Their rational individual decisions produce a market-level catastrophe — inventory locked at 3.8 months' supply (versus the 5–6 months that characterizes a balanced market), annual existing-home sales of just 4.06 million in 2025 — the lowest level since 1995.
Milton Friedman spent decades explaining that the unintended consequences of monetary intervention typically fall hardest on the people the intervention was not designed to harm. The near-zero rate environment of 2020–2021 was not designed to freeze the housing market. It was designed to support economic recovery. But the rate lock-in it created is now the dominant force suppressing existing home supply — holding prices elevated through scarcity, not through any underlying improvement in affordability or value. Buyers compete for artificially constrained supply and bid prices up. Sellers, unable or unwilling to move, don't list. The market's normal correction mechanism — price reductions to clear unsold inventory — is short-circuited because the inventory is not entering the market at all.
How Builders Adapted
In the facing of a frozen existing market and persistent affordability pressure, home builders have done what market actors do under competitive pressure: they adapted. The adaptations are visible in the data and they are not trivial.
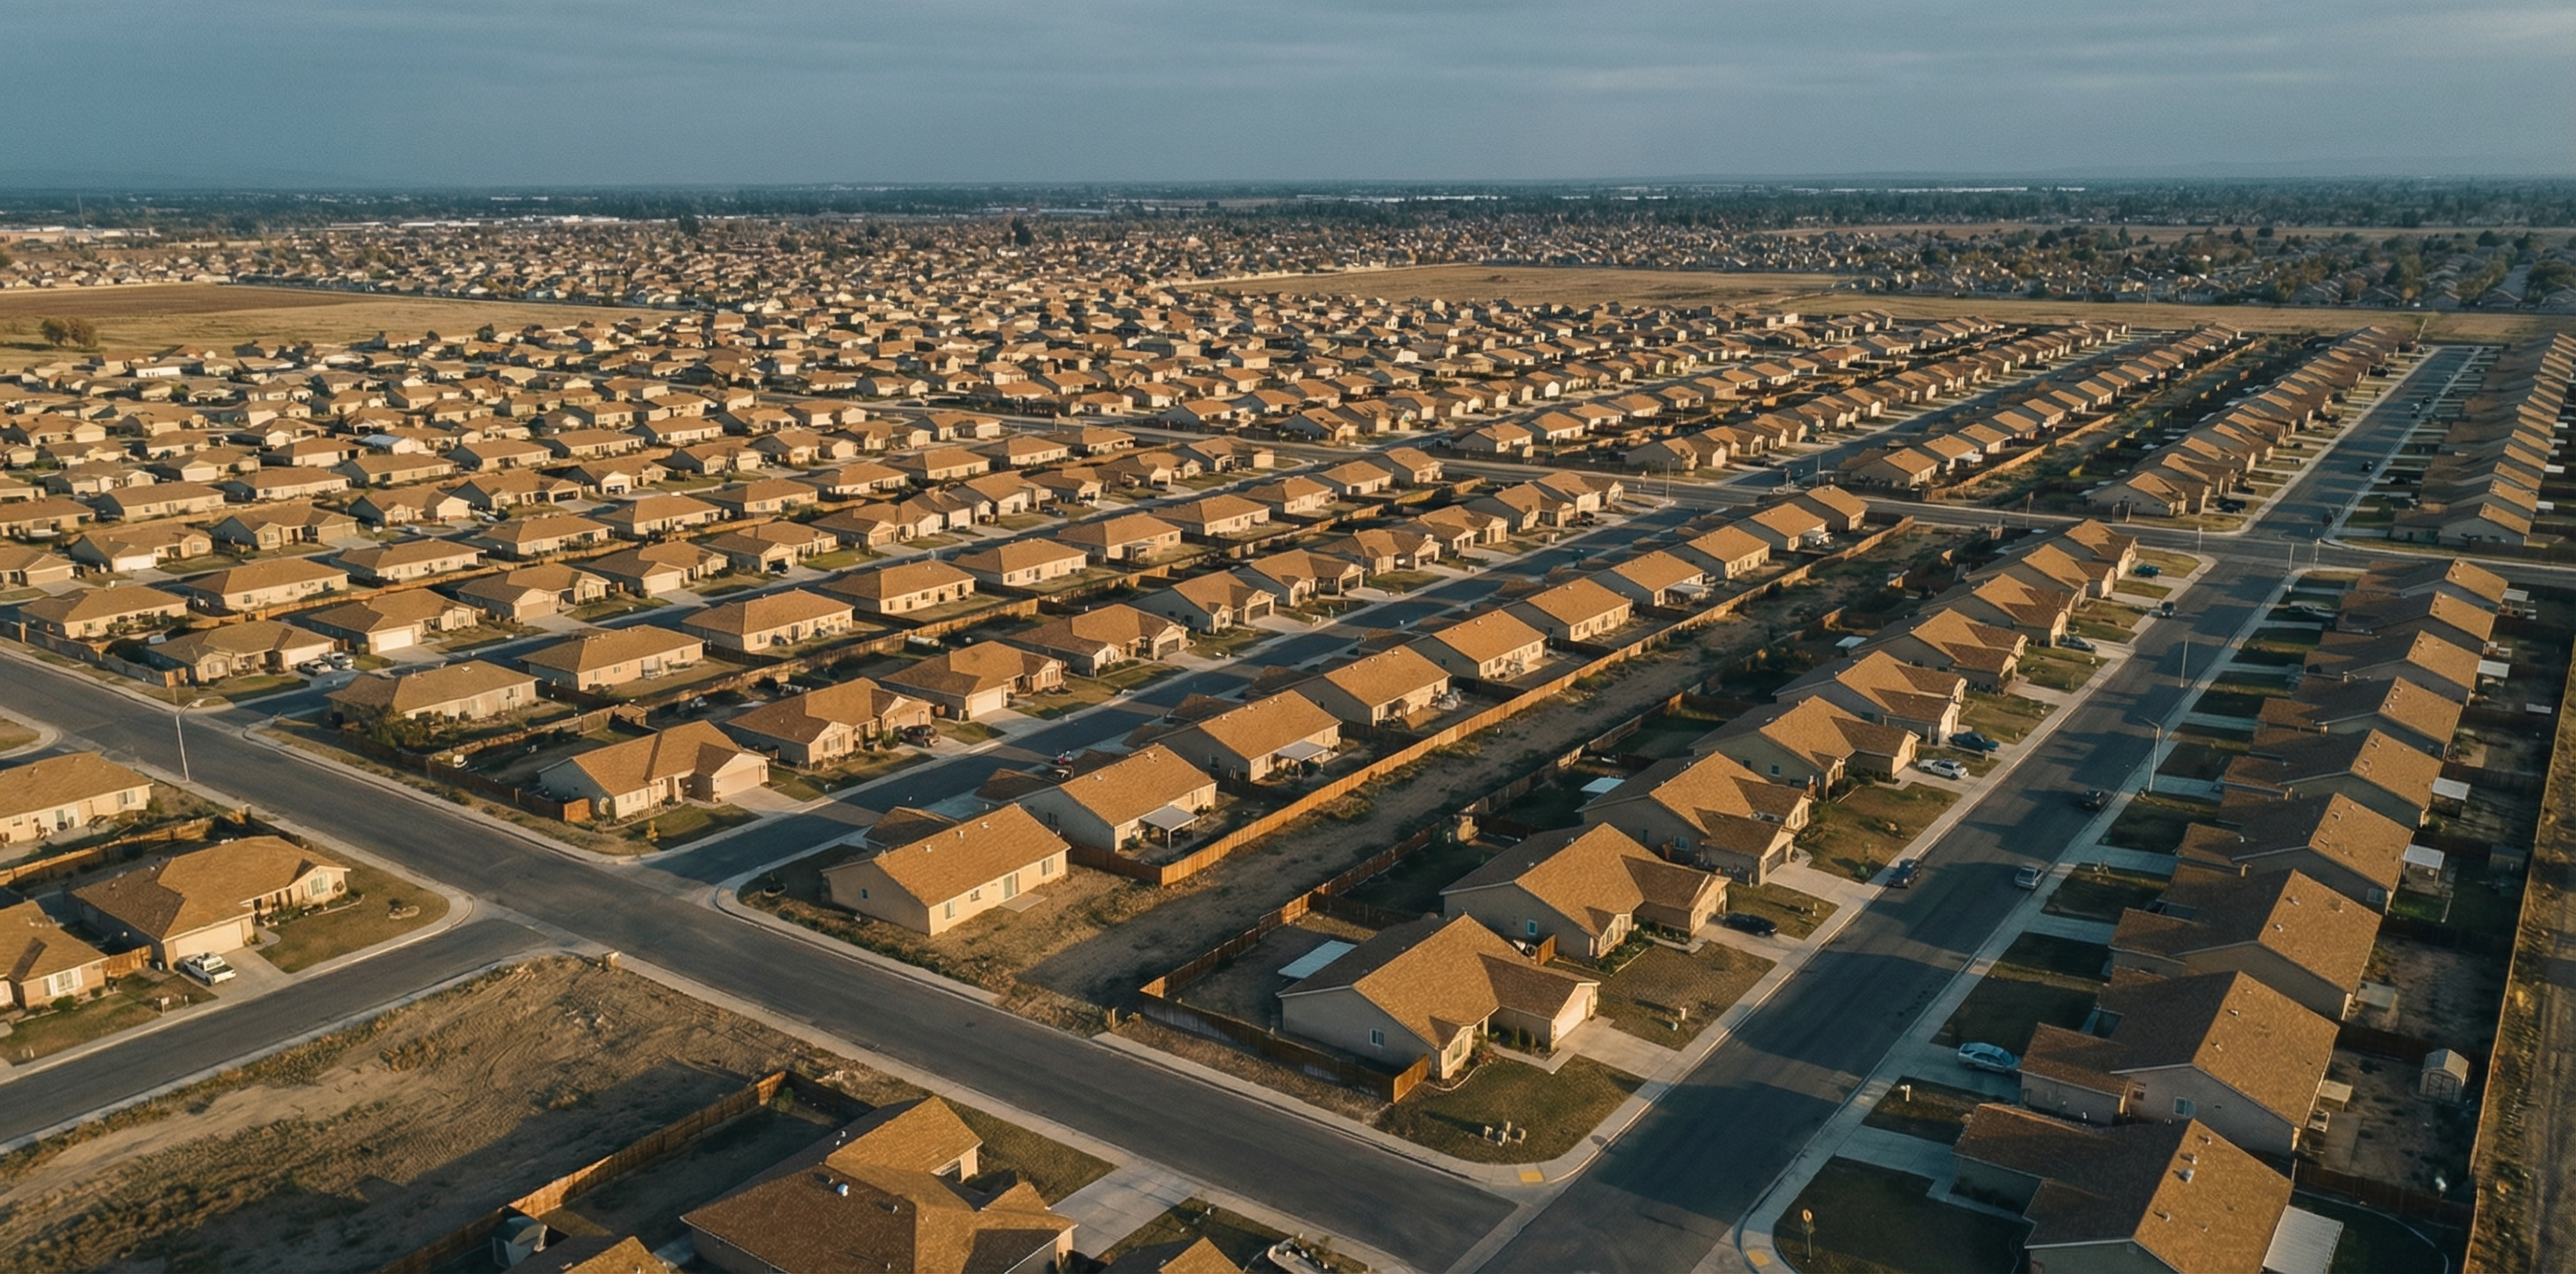
Builders have shifted to smaller lots, smaller homes, and more geographic concentration in lower-cost markets — particularly the South, where land-use regulation is comparatively lighter and land costs lower. The NAHB Housing Market Index for March 2026 stood at 38 — the 21st consecutive month below the 50-point threshold that separates growth from contraction — with 64% of builders offering sales incentives for 12 consecutive months and 37% cutting list prices by an average of 6%. This is not a market in equilibrium. It is a market where builders are absorbing significant margin compression to remain competitive against existing home inventory that cannot adjust its own supply.
The result is the price inversion: a new home that costs less than an existing one, not because construction has become cheap — building materials producer prices rose 3.4% year-over-year through February 2026 — but because builders have reduced the product. Median new-home square footage has declined from its 2015 peak, lots have shrunk, and geographic concentration has shifted toward the markets where land costs allow lower absolute prices. Thomas Sowell's "seen vs. unseen" framework is useful here: what we see is a lower median new-home price. What we don't see is that the new home of 2025 is a different — smaller, on a smaller lot, in a more geographically concentrated market — product than the new home of 2015. The price has compressed, but so has the underlying value delivered per dollar.
The Aging Stock — 47% Built Before 1980
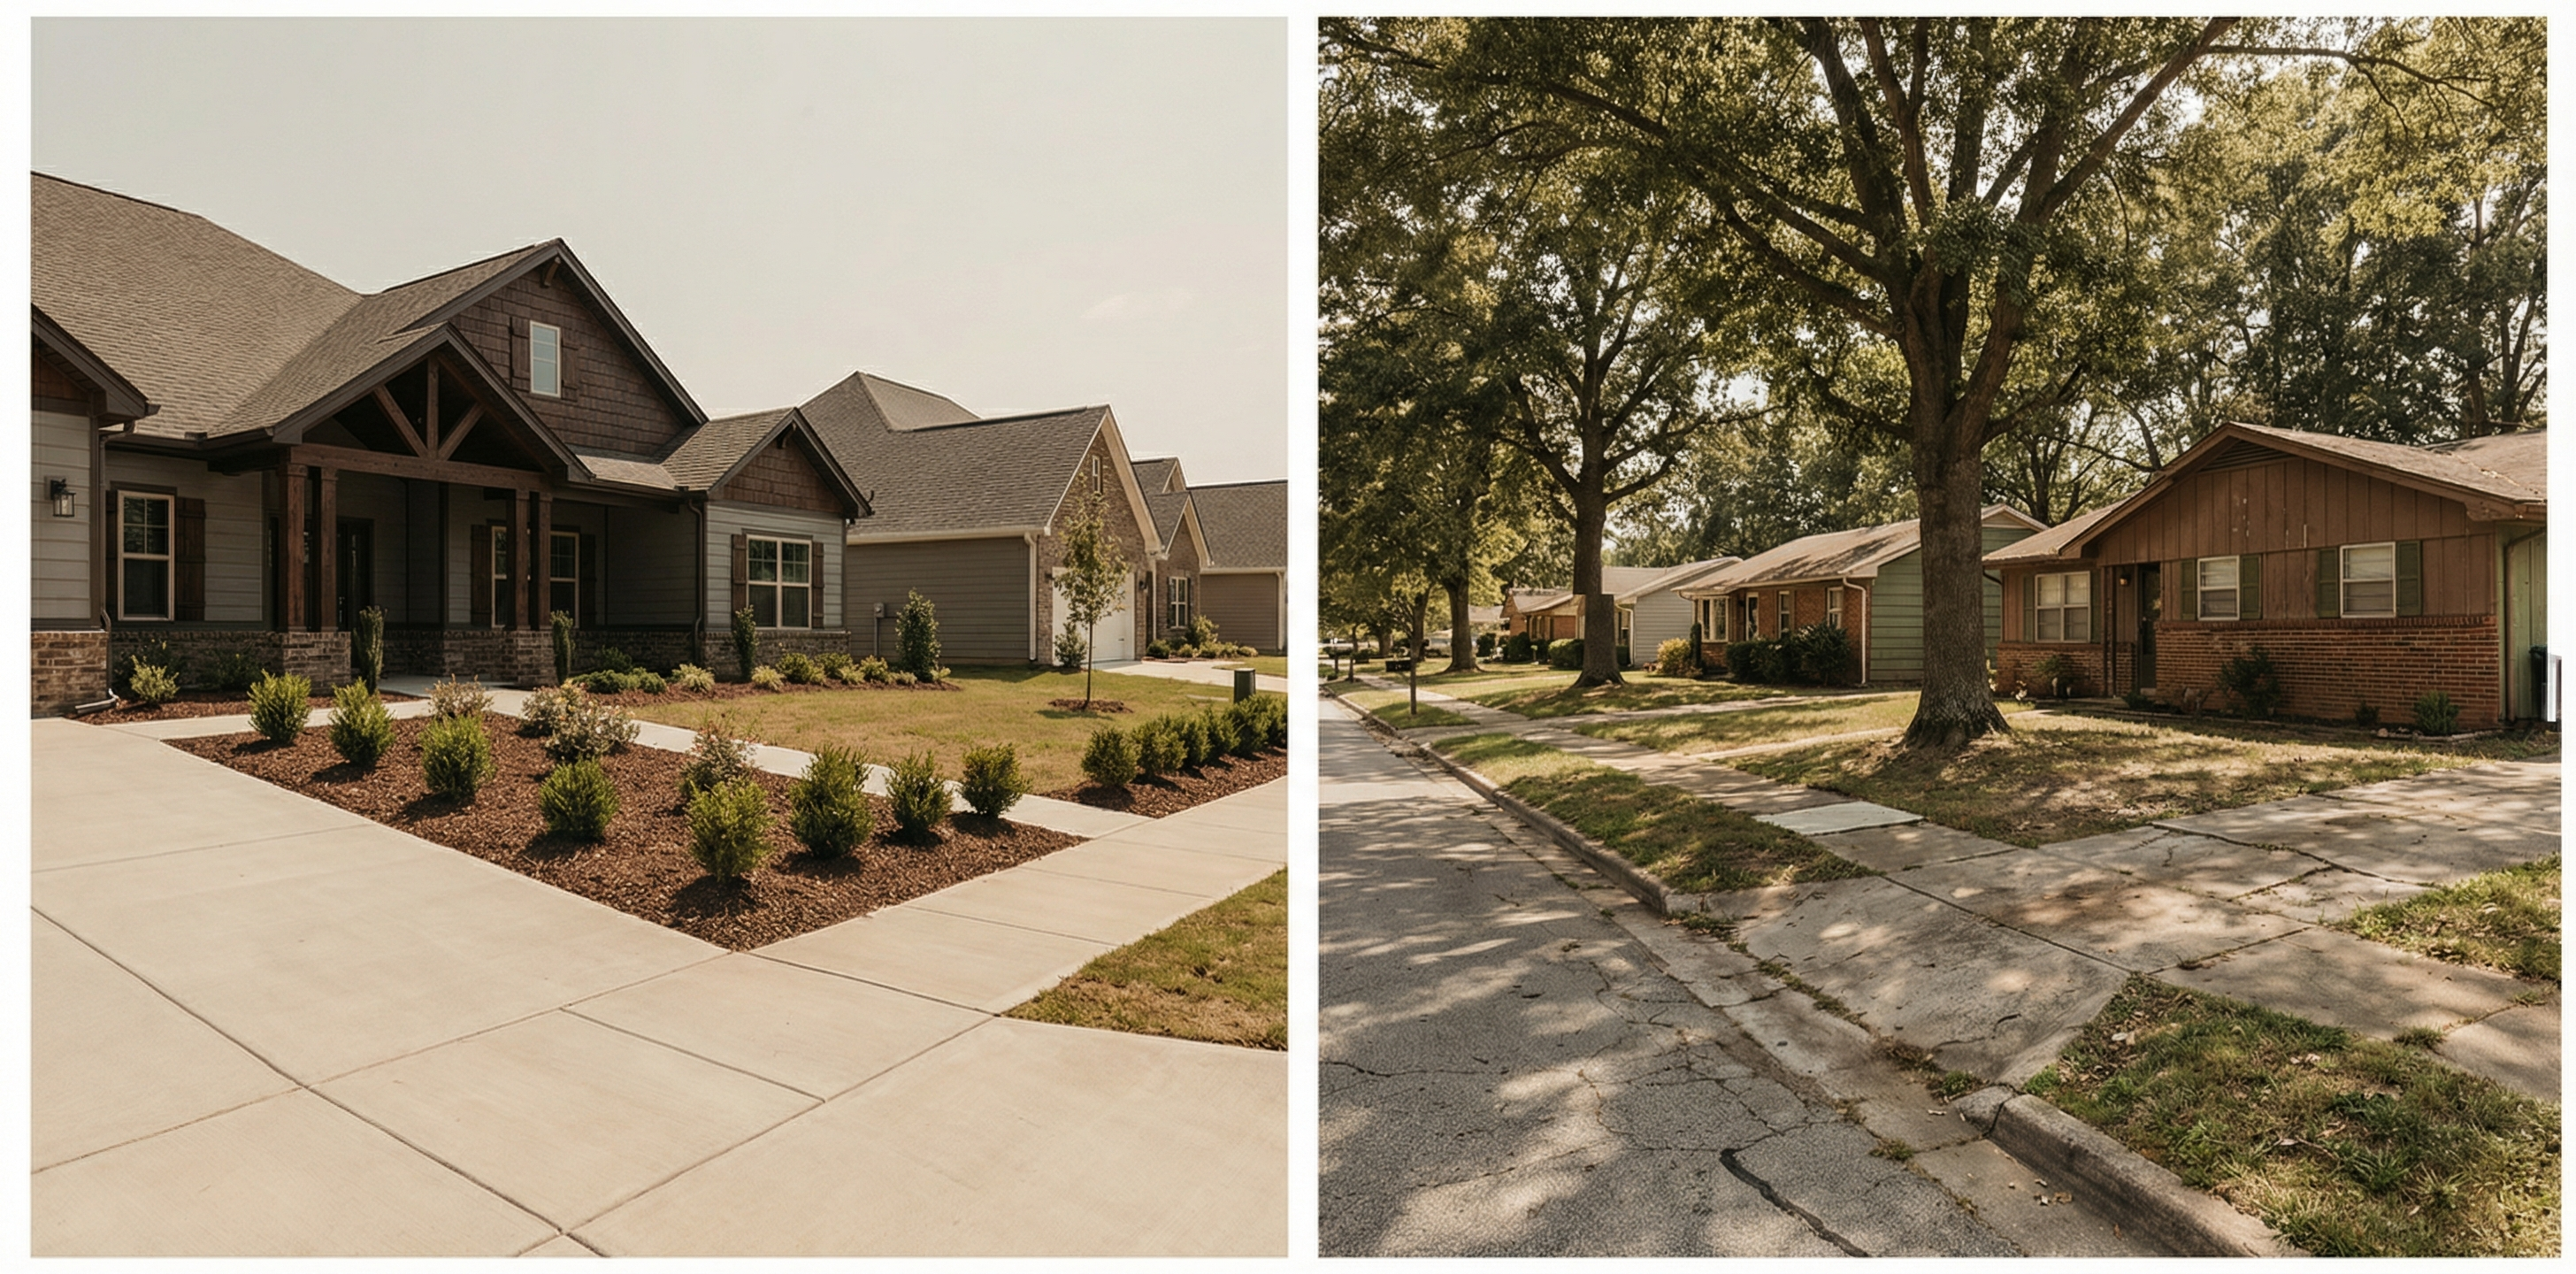
The 2024 American Community Survey adds a forward-looking dimension that the price data alone cannot capture: the existing homes that buyers are paying a premium for are, in aggregate, old. The median age of owner-occupied homes reached 42 years in 2024, up from 31 years in 2005 — an extraordinary 11-year aging in just two decades. Nearly half (47%) of owner-occupied homes were built before 1980, meaning they are at least 45 years old. A third were built before 1970.
Homes built before 1980 carry a distinct maintenance profile: electrical systems that predate modern codes, plumbing that may include galvanized pipe, roofs and HVAC systems at or past their useful life, and in many cases lead paint and asbestos concerns that require professional remediation. These are not cosmetic issues. They represent capital-intensive renovation costs that a simple median price comparison does not capture. The existing home a buyer pays $414,900 for today may require tens of thousands of additional dollars in deferred maintenance and code-compliance work that the median price headline does not reflect.
The geographic distribution of housing stock age is no accident. New York's median owner-occupied home age is 64 years; Massachusetts and Rhode Island, 59 years. These are precisely the states with the most restrictive local zoning regimes — municipalities that have blocked new residential construction for decades, preventing the natural renewal of the housing stock. At the other end of the spectrum: Nevada (25 years), Texas (28 years), South Carolina, Georgia, and Arizona — all below 29 years. The pattern is not coincidental. States that have allowed market-driven residential development have systematically newer, better-maintained housing stock. States that have used zoning to restrict supply have older stock, higher maintenance burdens, and — as the price data now confirm — higher costs for what the market does offer.
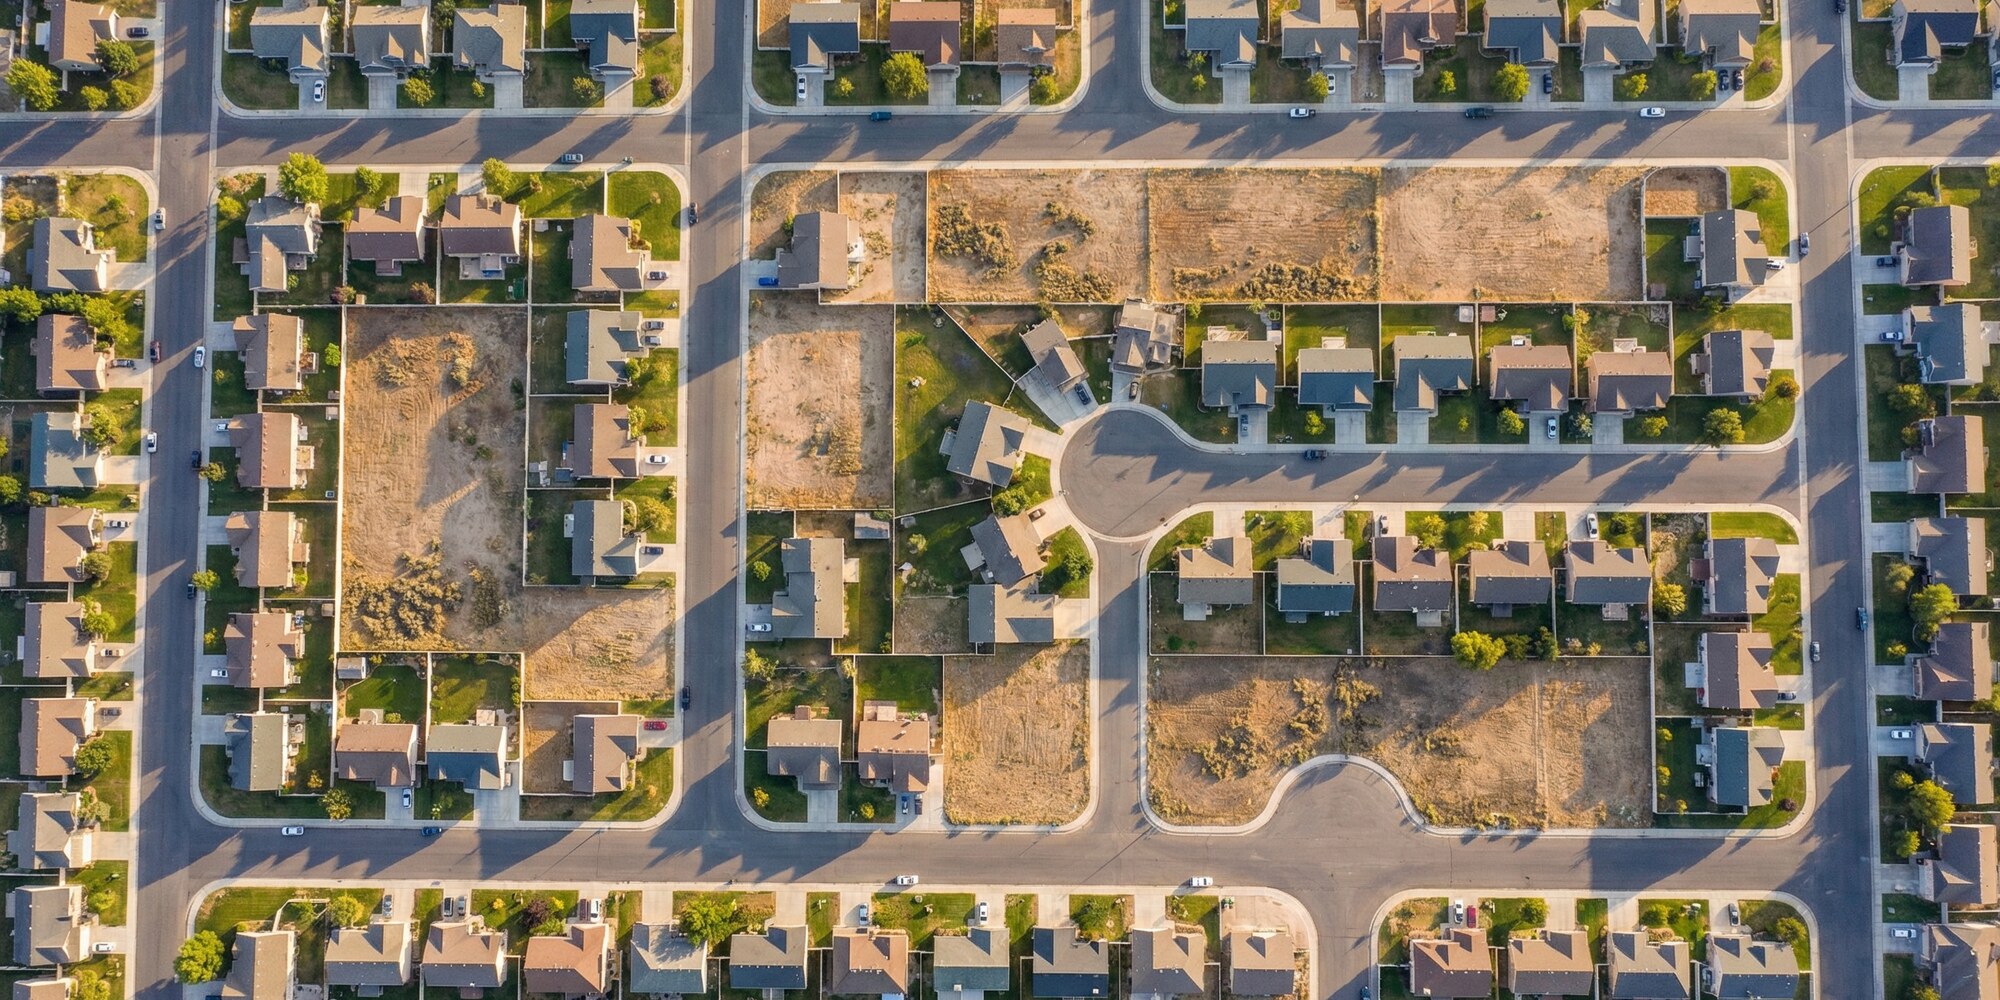
The supply failure compounds over time. From 2020 to 2024, new construction added approximately 3.6 million owner-occupied homes — just 4% of total owner-occupied stock. The share of owner-occupied homes less than 14 years old fell from 18% in 2014 to 13% in 2024. A housing stock that does not renew itself gets older, gets more expensive to maintain, and — when frozen by rate lock-in — commands prices that reflect scarcity rather than value. The market is not correcting the aging stock. Zoning has prevented the supply response that would correct it, and monetary policy has frozen the sellers who hold it.
A Distorted Price Signal
Friedrich Hayek's core insight about price systems was that prices aggregate dispersed, local knowledge that no central planner can replicate. In a normally functioning housing market, a premium on new construction signals that buyers value new product and that premium attracts investment. An inversion — existing homes priced above new construction — would normally signal that existing homes are scarcer, more desirable, or better located. Today's inversion signals none of those things. It signals a policy-created freeze.
The price system is directing buyer competition toward the segment of the market where supply is artificially constrained (existing homes locked by rate lock-in) and away from the segment that can actually expand in response to demand (new construction). Builders are compressing margins and reducing product specifications to compete with frozen existing inventory — a second-best adaptation to a distorted price environment, not the natural emergence of a supply response to genuine demand signals. The inversion is not the market working. It is the market trying to work around policy-created constraints.
The path back to a functioning price signal runs through supply and through monetary policy normalization. Zoning reform that allows new construction where demand is concentrated — particularly in the supply-constrained markets of the Northeast and West where the price inversion is most acute — would lower land costs relative to construction and allow builders to compete without compressing the product. The FHFA House Price Index rose just 1.8% nationally in Q4 2025, the slowest rate since Q2 2012, with 34 of the 100 largest metros recording year-over-year declines. The market is straining toward correction. The question is whether policy will allow the supply response that would make that correction durable, or whether the combination of rate lock-in, aging stock, and supply-suppressing zoning will continue to produce a market where buyers pay a premium for old homes and builders discount new ones.
Conclusion: Measuring the Dysfunction
The price inversion is not a recovery story. It is a measurement of how far the housing market has been distorted from equilibrium. Builders have achieved the remarkable feat of producing homes that cost less than equivalent existing ones — despite rising material costs, rising labor costs, and a builder confidence index stuck in contraction for 21 consecutive months. They have done this by building smaller, building cheaper, and building where regulation allows. That is market adaptation under duress, not a restoration of health.
The existing home market, meanwhile, holds prices above new construction through a freeze that monetary policy created and that zoning sustains. Forty-seven percent of the homes in that frozen market were built before 1980. The buyers competing for them are paying a premium for scarcity — not for value, not for quality, and not because the price signal reflects anything about the underlying productivity of the housing stock.
Friedman, Sowell, and Hayek all arrive at the same place from different angles: when government intervention distorts prices, the cost is borne by those the market would otherwise serve most efficiently — in this case, first-time buyers and renters who cannot enter a market where the existing stock is frozen, overpriced, and aging, and where new construction is discounting itself to compete against artificial scarcity. The inversion tells us precisely how deep that distortion runs.