Friday Market Recap — March 13, 2026: Rates Rebound, Tariffs Hit, and the Spring Market Faces a Dual Squeeze
· 10 min read · By Affordable Housing Initiative
The week of March 9–13, 2026 handed housing market watchers a concentrated dose of what policy-distorted markets look like in practice. Mortgage rates briefly broke below 6% for the first time since 2023 — then snapped back to 6.11% within days. On the same day as the latest rate reading, escalated steel and aluminum tariffs took effect, embedding an estimated $10,900 or more in per-home construction costs that builders will either absorb or pass along. Meanwhile, housing permits — the leading indicator of future supply — declined 5.8% year over year. The spring selling season is arriving, but it is walking into two government-generated headwinds blowing from opposite directions.
This is not a market failing on its own terms. It is a market trying to clear while two distinct categories of government intervention — monetary policy and trade protectionism — work simultaneously to suppress supply and distort demand. The data from this week illustrates those dynamics with unusual clarity. Below, we break down every major indicator released in the past five days.
This Week's Core Market Dashboard
The four headline numbers that define the week:
| Indicator | Current Reading | Prior Period | Year Ago |
|---|---|---|---|
| 30-Year Fixed Mortgage Rate | 6.11% (wk. ending Mar. 12) | 6.00% (wk. ending Mar. 6) | 6.65% |
| 15-Year Fixed Mortgage Rate | 5.50% | 5.43% | — |
| Median Existing-Home Price | $398,000 (Feb. 2026) | $396,800 (Feb. 2025) | +0.3% YoY |
| NAR Affordability Index | 117.6 (Feb. 2026) | 103.1 (Feb. 2025) | +14.5 pts YoY |
Sources: Freddie Mac PMMS via FRED; NAR Existing-Home Sales Report, March 10, 2026.
Mortgage Rates: A Window That Opened and Closed
The week's most watched data point arrived Thursday morning. Freddie Mac's Primary Mortgage Market Survey reported the 30-year fixed rate at 6.11% for the week ending March 12 — a rebound from 6.00% the prior week, which had itself been the first sub-6% print since late 2023.
That brief sub-6% window produced an unmistakable demand response. Mortgage Bankers Association data for the week ending March 6 showed purchase applications up 7.8% week over week and 10% above the same week a year ago — the strongest year-over-year purchase application reading in months. FHA purchase applications surged more than 11%, a signal that first-time buyers are watching rates closely and moving quickly when windows open.
The rate elasticity of housing demand is not a new observation, but this week's data sequence — rates dip below 6%, applications surge, rates climb back above 6% — makes it unusually legible. Demand exists. Buyers are ready. The constraint is price, and price is substantially a function of borrowing cost.
Milton Friedman's critique of monetary management applies here with precision. The Fed's near-zero rate policy of 2020–2021 pulled millions of buyers into the market at artificially suppressed borrowing costs, driving prices to levels the market could not have reached otherwise. The normalization of rates since 2022 has been, from the housing buyer's perspective, a process of paying the accumulated tab. The 30-year rate of 6.11% is not inherently high by historical standards — the post-WWII median is above 7%. What makes it painful is the combination with home prices that were inflated during the near-zero era. The Fed created the price, then raised the cost to access it.
| Rate Metric | Current Week | Prior Week | Source |
|---|---|---|---|
| 30-Year Fixed | 6.11% | 6.00% | Freddie Mac PMMS / FRED |
| 15-Year Fixed | 5.50% | 5.43% | Freddie Mac PMMS / FRED |
| Year-Ago 30-Year Rate | 6.65% | — | Freddie Mac PMMS / FRED |
| Purchase Apps (wk. Mar. 6) | +7.8% WoW / +10% YoY | — | MBA, March 11, 2026 |
Existing-Home Sales: Modest Improvement, Structural Ceiling
NAR's February 2026 existing-home sales report, released Monday, showed sales at 4.09 million annualized — up 1.7% from January and beating the consensus forecast of 3.89 million by a meaningful margin. It was the first monthly increase in three months. On the surface, positive.
The year-over-year picture is more honest: -1.4% below February 2025. The long-run median for existing-home sales is approximately 5.22 million units annualized. At 4.09 million, this market is transacting at roughly 78% of its historical norm. The structural explanation is well established: millions of homeowners locked 30-year mortgages at 2.5%–3.0% during 2020–2021 and have no financial incentive to sell and trade into a 6.11% mortgage. Supply remains constrained not by lack of housing stock but by the rate lock-in effect — a direct consequence of the Fed's monetary experiment distorting seller behavior on a massive scale.
Inventory remains critically below the threshold of a balanced market. Total listings stood at 1.29 million units — up 2.4% month over month and 4.9% year over year, progress but not resolution. At 3.8 months of supply, the market remains in seller territory; a balanced market requires 5 to 6 months. The median home price of $398,000 represented the 32nd consecutive month of year-over-year price increases, though the pace has slowed dramatically to +0.3% — effectively flat in real terms once shelter inflation is factored in.
| Indicator | Feb. 2026 | Jan. 2026 | Feb. 2025 |
|---|---|---|---|
| Existing-Home Sales (SAAR) | 4.09M | 4.02M (+1.7%) | 4.15M (-1.4% YoY) |
| Median Home Price | $398,000 | — | $396,800 (+0.3% YoY) |
| Total Inventory | 1.29M units | 1.26M (+2.4%) | 1.23M (+4.9% YoY) |
| Months of Supply | 3.8 months | 3.8 months | 3.6 months |
| NAR Affordability Index | 117.6 | — | 103.1 (+14.5 pts YoY) |
Source: NAR, February 2026 Existing-Home Sales Report.
Affordability Is Improving — Market Mechanisms at Work Despite Policy Headwinds
The most genuinely encouraging data point this week was the NAR Housing Affordability Index at 117.6 — up from 103.1 a year ago, and the highest reading since March 2022. An index above 100 means the median American household has sufficient income to qualify for the median-priced home at current mortgage rates using standard qualifying ratios. This is real progress, and it deserves recognition.
What's driving it? Wages. Median household income has grown faster than home prices in eight consecutive months. Income growth is outpacing home price appreciation by nearly four percentage points — a ratio that, if sustained, will continue to compress the affordability gap without requiring any policy intervention. The West region showed the most dramatic improvement: +17.0% year over year on the affordability index, with a monthly gain of +8.2% in existing-home sales, likely reflecting the high rate-sensitivity of California and Pacific Coast markets responding to any rate movement below 6%.
This is what market mechanisms look like when they are allowed partial operation: wages adjust, prices stabilize, buyers re-engage. The market did not need a new subsidy program or a government affordability initiative to produce this improvement. It needed time and the partial withdrawal of the monetary distortions that inflated prices in the first place. Thomas Sowell's point is apt: markets solve problems through price adjustment when they are permitted to do so. The affordability improvement of the past year is the market attempting to solve the affordability crisis that the prior decade of monetary policy created.
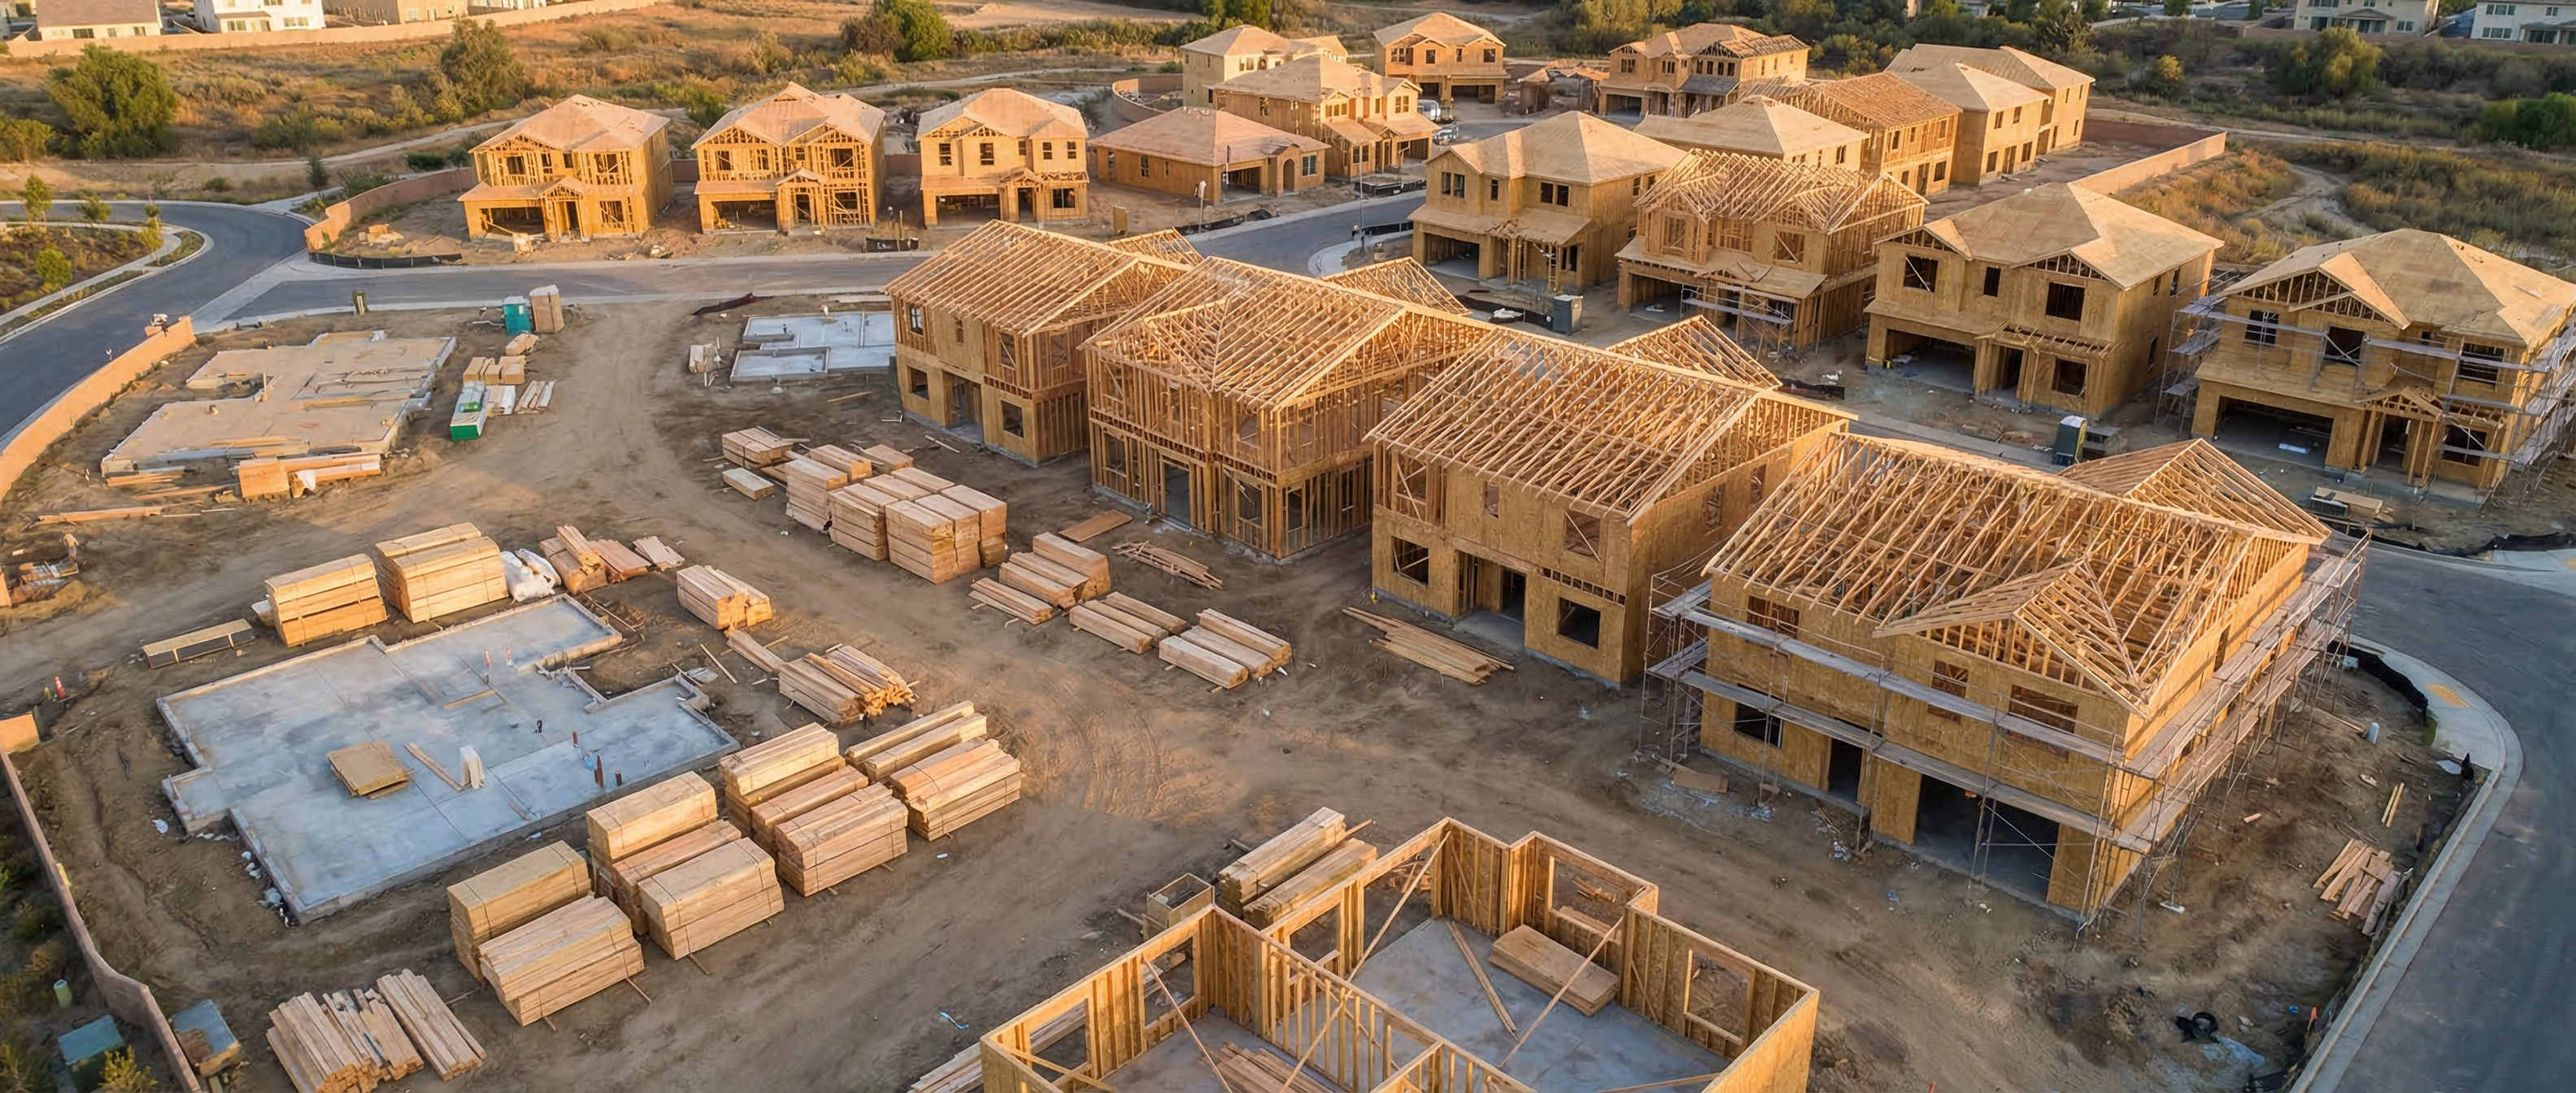
The Tariff Tax on New Home Construction
March 12, 2026 — the same day as the latest Freddie Mac mortgage rate release — marked the implementation of escalated steel and aluminum tariffs: 25% broadly, and 50% on Canadian steel. For the housing market, this is not an abstract trade policy story. It is a direct materials-cost event.
Canada supplies approximately 85% of U.S. softwood lumber imports. The effective tariff rate on Canadian lumber, combining antidumping duties, countervailing duties, and Section 232 tariffs, now stands at approximately 45%. According to NAHB analysis of tariff impacts on home building, tariff actions already in place as of April 2025 — before this week's escalation — added an estimated $10,900 per new home in costs. Building material costs overall have risen 34% since December 2020.
Milton Friedman stated the case against tariffs with characteristic clarity: a tariff is a tax on domestic consumers, disguised as protection for domestic producers. The beneficiary of a 45% tariff on Canadian lumber is a domestic sawmill operator. The bearer of the cost is every American family that purchases a newly constructed home. The cost is not hidden — it is embedded in the asking price — but it is opaque enough that most buyers have no idea a trade policy is a line item in their mortgage payment.
Thomas Sowell's framework applies equally: there are no free lunches in economics, only costs that are concentrated or dispersed. Concentrated protection for domestic lumber producers produces dispersed costs across the several hundred thousand families who buy new construction each year. Those families, individually, cannot organize to oppose the tariff. The lumber producers can. The political economy of protectionism is precisely this asymmetry.
The practical effect on the new-home market is already visible in builder behavior. NAHB's Housing Market Index for February 2026 came in at 36 — below the 50-threshold that separates optimism from pessimism — for the 20th consecutive month. Thirty-six percent of builders cut prices in February to move inventory, with average price reductions of 6%. Sixty-five percent are using sales incentives. These are not the metrics of a healthy supply pipeline.
| Builder Sentiment Metric | Feb. 2026 | Jan. 2026 |
|---|---|---|
| NAHB/Wells Fargo HMI (Overall) | 36 | 37 |
| Current Sales Conditions | 41 | 41 |
| Sales Expectations (Next 6 Months) | 46 | 49 |
| Traffic of Prospective Buyers | 22 | 24 |
| Share of Builders Cutting Prices | 36% | 40% |
| Share Using Sales Incentives | 65% | 65% |
Source: NAHB Housing Market Index, February 2026.
Builders cannot simultaneously maintain margins, reduce prices to attract buyers, and absorb escalating material costs. Something gives. Either starts slow further as projects become economically unviable, or costs are passed to buyers in higher prices. Both outcomes are hostile to affordability. Both are consequences of government trade policy, not market failure.
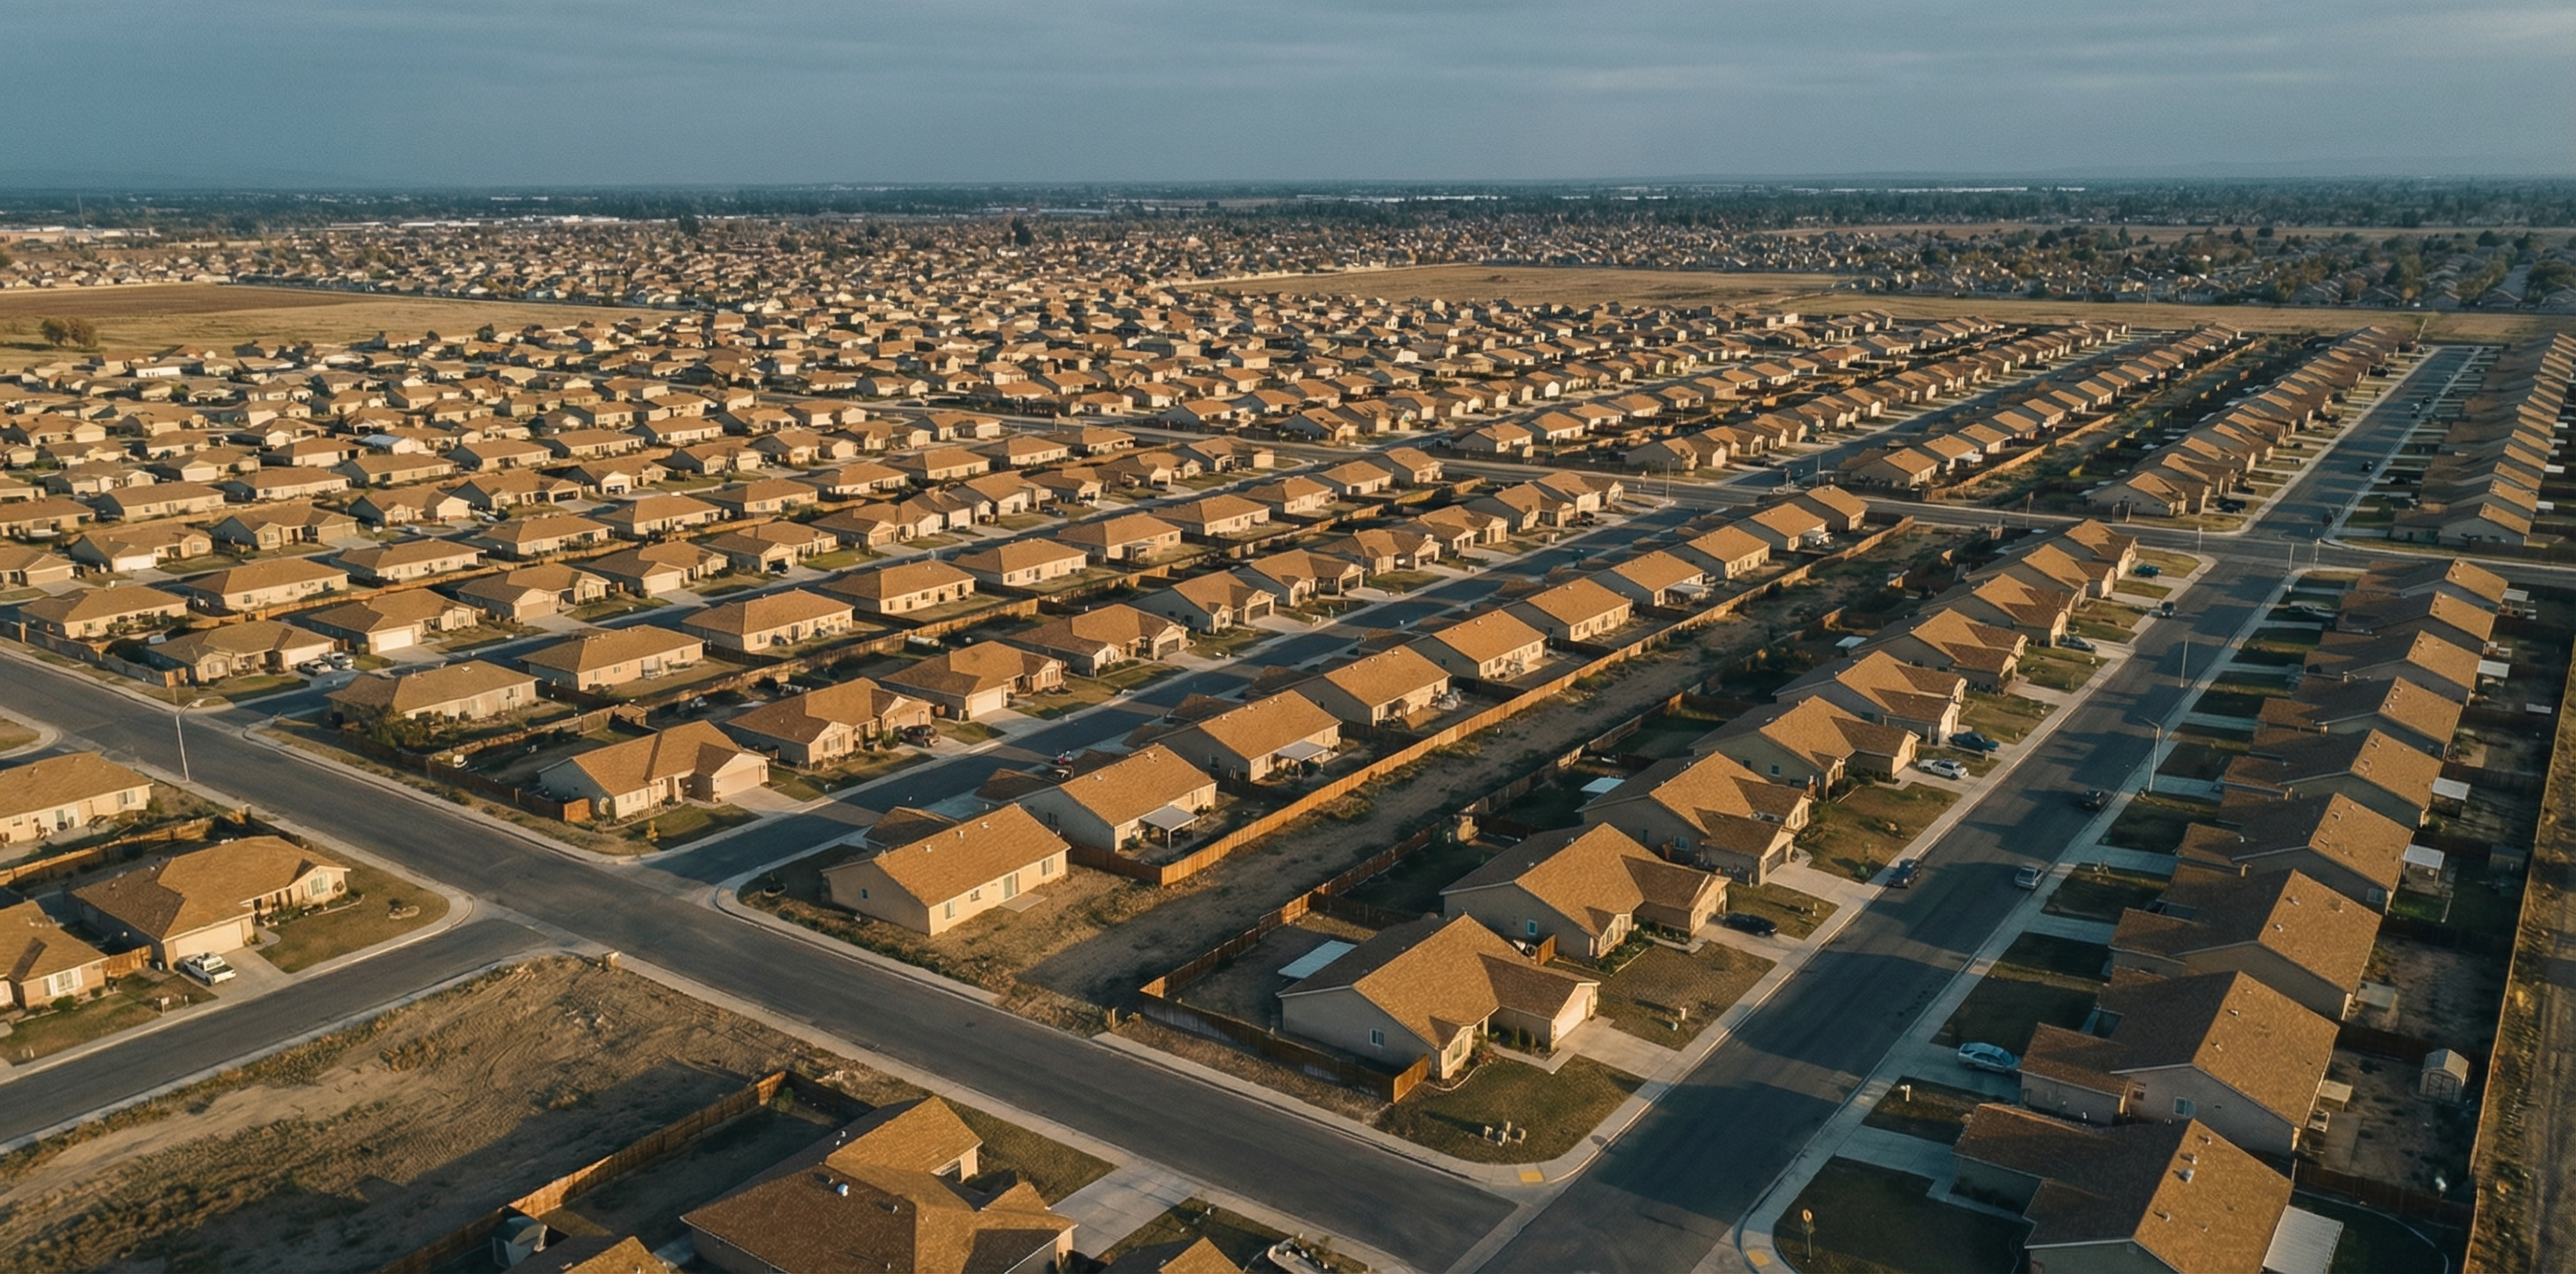
Supply Signals Are Flashing Yellow
The Census Bureau's New Residential Construction report for January 2026, released Wednesday (note: this report covers January data due to a delayed February 18 release), produced a misleading headline and an important underlying signal.
The headline: total housing starts at 1,487,000 SAAR, up 7.2% month over month and 9.5% year over year. Sounds like a construction boom. The data beneath the headline is less encouraging.
Single-family starts declined 2.8% month over month to 935,000 SAAR. The total headline jump was driven by multifamily — the apartment construction that serves renters, not the single-family homes that represent the primary unmet demand. Single-family starts are the unit type most directly linked to first-time buyer and move-up buyer demand, and they moved in the wrong direction.
More importantly: building permits fell 5.4% month over month and 5.8% year over year to 1,376,000 SAAR. Permits are the leading indicator. A project that is not permitted today will not be started in four to six months. Single-family permits came in at 873,000 — down 0.9% month over month. Completions were strong at 1,527,000 SAAR (+4.8% MoM), meaning homes already in the pipeline are finishing — but the pipeline itself is narrowing.
| Construction Metric (Jan. 2026 SAAR) | Jan. 2026 | Dec. 2025 | YoY Change |
|---|---|---|---|
| Total Housing Starts | 1,487,000 | 1,387,000 (+7.2%) | +9.5% |
| Single-Family Starts | 935,000 | 962,000 (-2.8%) | — |
| Total Building Permits | 1,376,000 | 1,455,000 (-5.4%) | -5.8% |
| Single-Family Permits | 873,000 | 881,000 (-0.9%) | — |
| Total Completions | 1,527,000 | 1,457,000 (+4.8%) | — |
Source: Census Bureau / HUD, New Residential Construction — January 2026 (released March 12, 2026).
From an Austrian economics perspective, permits are a price signal about future supply. When permits fall 5.8% year over year at the precise moment tariffs on building materials are escalating, the signal is that the supply pipeline is contracting under cost pressure — exactly when it should be expanding to address the structural shortage that has driven prices to near-$400,000 medians.
Shelter Inflation: The Fed's Tool Can't Fix the Supply Problem
The Bureau of Labor Statistics February 2026 Consumer Price Index, released Tuesday, showed all-items CPI at +2.4% year over year — unchanged from January and broadly on track with the Fed's 2% target approach. Core CPI held at +2.5% YoY.
The shelter component told a different story. Shelter CPI rose 3.0% year over year — exactly 1.25 times the overall inflation rate — and increased 0.2% month over month, making it the largest single contributor to the February monthly CPI increase. Rent of primary residence and owners' equivalent rent both reflect lagging measures of actual rents, which means shelter CPI will remain elevated for months after actual rental market conditions improve.
The more fundamental point is structural: shelter inflation persists at rates above the overall CPI because housing supply is constrained. The Federal Reserve's rate hikes can suppress consumer demand for goods and services. They cannot conjure a new apartment building or a subdivided lot. When supply is restricted through zoning, regulation, permitting delays, and — as this week illustrated — material cost tariffs, prices reflect that scarcity regardless of what the central bank does with short-term interest rates.
The Fed raised rates to fight inflation it helped generate. In doing so, it increased the cost of construction financing, reduced builder confidence, and suppressed starts — thereby tightening the supply constraint that keeps shelter inflation sticky. This is the policy trap Hayek identified: government interventions in one sector generate consequences that constrain policy options in another, compounding the original problem rather than solving it.
FOMC Watch: What a March 18 Hold Means for Spring
The Federal Open Market Committee meets March 17–18. At its January 28, 2026 meeting, the FOMC held the federal funds rate at 3.50%–3.75%, pausing after three cuts in late 2025. Markets are pricing minimal probability of a cut at the March 18 decision; the CME FedWatch tool shows the vast majority of market positioning expecting another hold. According to the Federal Reserve's meeting calendar, the March 18 decision will be the first FOMC communication since the tariff escalations took full effect.
For housing: a hold keeps the federal funds rate above the neutral rate, sustaining upward pressure on long-term Treasury yields and, by extension, mortgage rates. The 30-year mortgage rate is likely to remain in the 6.0%–6.5% corridor through the spring selling season absent a significant deterioration in economic data. If the tariff-driven input cost increases flow through to producer price indices and then to CPI in coming months, Fed officials may face an awkward trade-off: premature rate cuts risk re-accelerating inflation, while an extended hold keeps housing affordability constrained at a politically sensitive moment.
Chair Powell has been candid: "It's hard to look at the data and say policy is significantly restrictive right now." Multiple forecasters, including JP Morgan strategists, see no cut until summer 2026 at the earliest. The spring buying season that briefly looked promising — applications up 10% YoY on a sub-6% rate reading — will now navigate a 6%+ rate environment with no near-term relief visible.
The Week in Review: Two Government Policies, One Affordability Constraint
Step back from the individual data points and the week's pattern is coherent. The NAR Affordability Index at 117.6 is the highest in four years — genuine progress, driven by wage growth outpacing price appreciation. Purchase applications running 10% above last year demonstrate that buyer demand has not evaporated. The market wants to clear.
Against that backdrop, two distinct government interventions are applying countervailing pressure. Monetary policy — the Fed's elevated rate stance maintained to fight the inflation that its prior rate suppression helped create — keeps borrowing costs above what wage-normalized home prices would naturally require. Trade policy — tariffs on Canadian lumber, steel, and aluminum — embeds $10,900 or more per new home in costs that either reduce the supply that enters the market (as builder economics deteriorate) or raise the prices buyers must pay.
Building permits falling 5.8% year over year while material costs are rising. Builder confidence sub-50 for 20 consecutive months. A median home price of $398,000 with rates above 6%. These are not market failures. They are the predictable outputs of a policy environment that restricts supply through regulation, distorts demand through monetary manipulation, and now taxes the inputs of construction through trade protectionism.
Friedrich Hayek's insight was that central planners cannot possess sufficient knowledge to override the price signals of a dispersed market without generating unintended consequences. The housing market in March 2026 is a case study in exactly those consequences: a sub-6% rate window so brief it closed before buyers could fully respond; permits declining as builders rationally retreat from a cost structure that trade policy has made uneconomic; affordability improving only because wages are finally catching up to the prices that monetary policy inflated. The path to durable affordability does not run through more intervention. It runs through less.
Next week: The March 17–18 FOMC decision and its direct implications for the spring mortgage rate trajectory. We will cover Powell's press conference and any updated dot plot projections.